Why Soil Testing Is Often the Highest-Return Input on the Farm
A soil test earns its keep when it changes a costly decision. Field-response data show where phosphorus is likely to pay, where it probably will not, and why representative sampling matters more than a long list of analyses.
A soil test does not make money by producing a report. It makes money when it changes a decision: applying phosphorus where a crop is likely to respond, withholding it where the probability of response is small, correcting acidity before it limits yield, or showing that a suspected nutrient problem is actually something else.
That distinction matters in 2026. Fertilizer remains one of the largest variable costs in crop production, while university soil-test recommendations are built from field-response trials that separate likely responses from unlikely ones. The economic case is therefore not that every test produces a fixed return. It is that a representative, locally calibrated test can reduce uncertainty around decisions worth tens of dollars per acre for a laboratory fee that may be only a few dollars per sampled acre.
Bottom line
Soil testing has its highest return when the result can change a lime, phosphorus, potassium, manure-allocation, or diagnostic decision. It has little value when the sample is unrepresentative, the wrong analytical method is used, or the report is filed without changing the plan.
87%
Very-low-P Minnesota trials responding to P
7%
Very-high-P trials responding to P
10–15
Cores in an Iowa composite sample
$15
Example university lab fee per sample
The value is knowing the probability of a response
A phosphorus or potassium soil test is not a measurement of every pound of nutrient in the root zone. It is an availability index calibrated against crop response. Researchers apply several fertilizer rates across soils with different test values, measure yield, and identify the test ranges where an application is likely to pay.
Minnesota Extension summarizes that relationship using corn phosphorus trials. Applying P increased grain yield in 87% of very-low-testing situations and 83% of low-testing situations. The response frequency dropped to 27% at medium, 13% at high, and 7% at very high. Just as important, unfertilized corn in the high and very-high categories averaged 99% of maximum yield. The test does not promise a response; it changes the odds.
Figure
How often phosphorus increased corn yield in Minnesota trials
Very low
87 %
Low
83 %
Medium
27 %
High
13 %
Very high
7 %
Source: University of Minnesota Extension, Understanding Phosphorus Fertilizers, Table 4. Categories are based on Minnesota-calibrated Bray-1 or Olsen P tests; do not transfer the numeric thresholds to another state without its calibration.
Click to expand
Iowa's field-calibrated categories tell the same story. Iowa State estimates that P or K applications produce a yield response about 80% of the time in the very-low category, 65% in low, 25% in optimum, 5% in high, and less than 1% in very high. This is why a blanket cut during an expensive fertilizer year can be as costly as blanket application: low-testing acres are where fertilizer is most likely to protect yield.
What a test can change on a fertilizer order
For corn grain in Iowa, the current guide recommends 100 lb P2O5 per acre in the very-low category, 75 in low, 58 in optimum, and zero in high or very high. The optimum rate is a removal-based maintenance rate for an assumed 180-bushel yield; the rates must be adjusted to the field, crop, yield history, test method, and local recommendation system.
Figure
Iowa corn phosphorus recommendation changes with the soil test
Very low
100 lb P2O5/ac
Low
75 lb P2O5/ac
Optimum
58 lb P2O5/ac
High
0 lb P2O5/ac
Very high
0 lb P2O5/ac
Source: Iowa State University Extension PM 1688, Table 3. Rates are for corn grain and Iowa-calibrated tests. The optimum rate assumes approximately 180 bu/acre; high-testing fields may still warrant a small starter under specified cool, wet, high-residue, or late-planting conditions.
Click to expand
A transparent break-even example
Suppose a representative test moves a 100-acre field from an assumed optimum-maintenance plan of 58 lb P2O5 per acre to Iowa's high category, where the recommendation is zero. The gross fertilizer expenditure avoided is:
Use your delivered nutrient price
Avoided fertilizer cost = 58 lb P2O5/acre × delivered price per lb P2O5. At an illustrative $0.80/lb, that is $46.40/acre, or $4,640 across 100 acres, before subtracting sampling, analysis, spreading, and advisory costs. This is a scenario, not a current fertilizer-price quote.
Illustrative value of withholding a 58-lb P2O5 maintenance rate
Delivered P2O5 price
Gross avoided cost/acre
Gross avoided cost on 100 acres
$0.60/lb
$34.80
$3,480
$0.80/lb
$46.40
$4,640
$1.00/lb
$58.00
$5,800
Illustrative sensitivity calculation using Iowa State's 58 lb P2O5/acre optimum corn maintenance rate versus 0 lb/acre in the high category. Insert your own delivered nutrient and application costs; this is not a price forecast.
The opposite calculation matters just as much. In the Minnesota dataset, corn without P averaged only 87% of maximum yield in very-low soils and 90% in low soils. A test can prevent a false economy by identifying acres where cutting fertilizer carries a high probability of lost yield.
The laboratory fee is usually the smallest part of the decision
University laboratory fees provide a useful scale, although commercial prices and analytical packages vary. The University of Connecticut lists $15 for a standard nutrient analysis. If one representative composite sample covers 10 acres, the laboratory fee alone is $1.50 per acre; at 15 acres it is $1.00. Labor, shipping, consulting, zone creation, and grid or precision sampling add real costs and should be included in a farm's calculation.
Figure
Illustrative laboratory fee per represented acre
1 acre
15 $/ac
5 acres
3 $/ac
10 acres
1.5 $/ac
15 acres
1 $/ac
Calculated from UConn's published $15 standard nutrient-analysis fee. This chart excludes collection labor, probe or service fees, shipping, interpretation, and precision-sampling costs. A sample should cover only an agronomically uniform area; acreage should never be expanded merely to lower cost.
Click to expand
A cheap test is not automatically economical. Intensive grid sampling and variable-rate application add cost, and Iowa research found little yield advantage from variable-rate P in fields that were predominantly optimum or high. The value of more intensive sampling depends on within-field variability, the proportion of responsive acres, fertilizer prices, application costs, and whether management zones are real and repeatable.
Sampling quality determines whether the economics are real
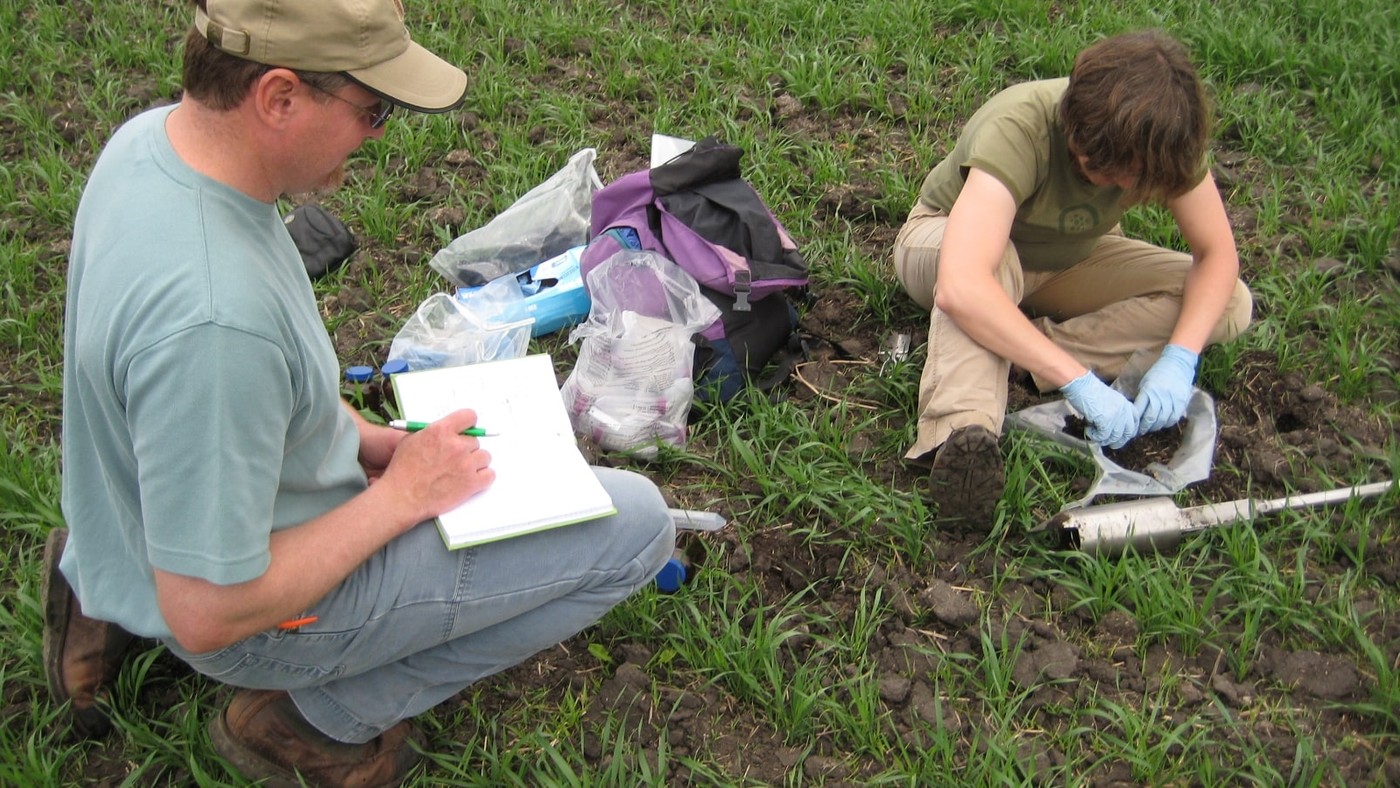
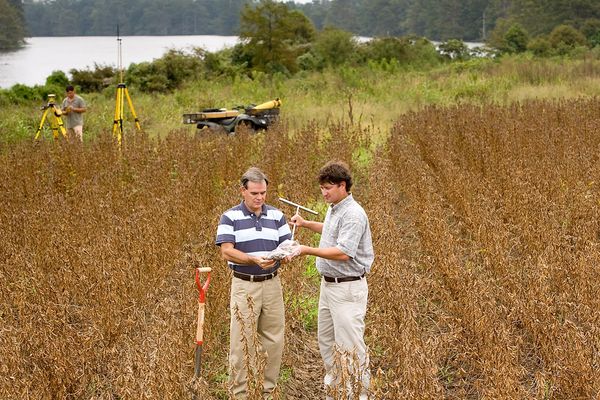
The laboratory analyzes a few grams, not the field. Most bad soil-test decisions begin before the sample reaches the lab. A single core from a convenient gate can be precise in the laboratory and still be wrong for the management area it claims to represent.
Iowa State recommends 10 to 15 cores for a composite sample and a consistent six-inch depth for its P, K, and lime calibrations. Penn State recommends at least 15 to 20 subsamples from a uniform area of 10 acres or less. These are regional recommendations, but the principles travel: separate areas with different soils or histories, avoid fertilizer bands and atypical spots unless sampling them deliberately, control depth, and repeat the same method and season.
Divide before you composite. Separate contrasting texture, slope, drainage, manure history, crop history, and visibly poor areas.
Match depth to the calibration. A six-inch recommendation cannot be interpreted cleanly from an inconsistent three-to-eight-inch set of cores.
Record the method. Save the date, depth, core count, GPS area, crop, recent fertilizer and manure, tillage, and laboratory method.
Do not overreact to one number. Iowa State notes routine within-lab variation of roughly ±10% for P and K and ±0.1 pH unit, before field-sampling variation is added.
Use trends carefully. Retest the same area with the same method and similar timing. Unusual drought and soil moisture can shift P, K, and pH results.
Garbage in, expensive recommendation out
More laboratory precision cannot rescue a sample that mixes different management zones or misses the field's variability. Spend first on a defensible sampling design; add analytical extras only when they answer a management question.
Not every number on a soil report has the same decision value
What common soil tests can and cannot decide
Measurement
Strongest management use
Important limitation
pH + buffer pH
Whether lime is needed and how much reserve acidity must be neutralized
Target and lime equation are crop-, soil-, and region-specific
Calibrated P and K
Probability of yield response; build, maintain, or withhold
Extractant, lab handling, crop, and regional calibration must match
Nitrate-N
Time-specific N decisions such as pre-sidedress testing in validated systems
Nitrate changes rapidly with weather, drainage, mineralization, and crop uptake
Organic matter
Context for nutrient cycling and a long-term trend
Small year-to-year changes can be sampling or laboratory noise
CEC
Context for texture, nutrient retention, and some recommendation systems
Not an annual performance score and not a universal amendment target
Biological indicators
Track direction under deliberate management change
Many lack universal thresholds and direct crop-response calibrations
A soil report is a set of different indicators, not one unified score. Use each result only for decisions supported by its sampling protocol and regional calibration.
Routine testing does not solve nitrogen by itself
The original version of this article treated available nitrogen as though it behaved like P or K. It does not. Nitrate is mobile and changes quickly with rainfall, temperature, drainage, mineralization, manure history, and crop uptake. In-season tools such as the late-spring or pre-sidedress soil nitrate test can answer a defined question in systems where they are locally validated. A routine fall fertility panel should not be treated as a universal season-long N prescription.
Soil-health tests add a different kind of value
Respiration, active carbon, aggregate stability, potentially mineralizable N, and microbial-community tests can help monitor whether management is shifting soil function. Their best economic use is usually trend detection on comparable soils sampled consistently, not replacing calibrated P, K, pH, or nitrate tools. Order an add-on when you can name the decision it informs: comparing a cover-cropped field with a reference strip, tracking reduced tillage, or diagnosing a constraint that routine chemistry cannot explain.
pH may be the highest-return number on the report
Nutrient recommendations attract attention, but pH can control the return to several inputs at once. Acidity affects nutrient availability, aluminum and manganese toxicity, legume performance, microbial processes, and some herbicides. Buffer pH or another reserve-acidity method is needed to estimate lime requirement; water pH alone does not tell you how much lime the soil needs.
A Missouri Extension example reports that raising salt pH from 4.5 to 6.0 increased soybean yield 15% in the cited Missouri research, equivalent to about 6 bushels per acre from a 40-bushel baseline. That result should not be treated as a universal lime response, but it shows why testing can reveal a constraint that another bag of fertilizer will not fix.
A practical testing plan that earns its keep
The most profitable testing program is not the largest package. It is the smallest defensible program that changes important decisions and leaves a repeatable record.
1. Start with the decision. Lime? P and K? Manure allocation? A poor-performing zone? A soil-health trend? Do not order a test because it is available.
2. Use your state's calibrated method. Confirm sampling depth, extractant, laboratory handling, crop category, and recommendation system before collecting soil.
3. Draw management areas before sampling. Separate areas that will receive different decisions. Composite enough cores within each uniform area.
4. Price the decision, not just the test. Calculate the value of fertilizer applied, withheld, or reallocated; include collection, analysis, consulting, application, and risk.
5. Save a clean baseline. Keep maps, GPS boundaries, lab methods, reports, rates, yields, and weather notes so the next test becomes a trend rather than another isolated number.
6. Retest on a rational interval. Iowa recommends about every two years for most cropping systems, with three to four years potentially acceptable near optimum under maintenance fertility. Follow local guidance and shorten the interval when a high-value decision or rapid drawdown warrants it.
The question to ask before buying any analysis
What will I do differently if this result is low, medium, or high? If the answer is nothing, the test may be interesting, but it is not yet a management investment.
The honest conclusion
Soil testing is often one of agriculture's highest-return information investments, but not because every sample saves 15% or 30% on fertilizer. There is no defensible universal savings percentage. Its value comes from sorting acres and decisions into different risk categories: likely response, uncertain response, and unlikely response; lime now or monitor; apply manure here rather than there; investigate fertility or look for another cause.
A representative sample analyzed by the right method can protect yield on deficient ground and prevent spending on nutrients already supplied by the soil. A poor sample can do the opposite with impressive-looking precision. The report is not the product. The better decision is.
Source material for every claim in this article, plus a citation-ready record for reference managers and scholarly indexes.
Cite this
Reference this work
SHE-ART-2025-0002
Saurav Das (2025). Why Soil Testing Is Often the Highest-Return Input on the Farm. Soil Health Exchange. SHE-ART-2025-0002. https://soilhealthexchange.com/cite/SHE-ART-2025-0002
Das, S. (2025). Why Soil Testing Is Often the Highest-Return Input on the Farm. Soil Health Exchange. https://soilhealthexchange.com/blog/why-soil-testing-is-the-most-cost-effective-decision-in-modern-agriculture
More citation formats
MLA
Das, Saurav. "Why Soil Testing Is Often the Highest-Return Input on the Farm." Soil Health Exchange, 2025-12-06, https://soilhealthexchange.com/blog/why-soil-testing-is-the-most-cost-effective-decision-in-modern-agriculture.
Chicago
Das, Saurav. "Why Soil Testing Is Often the Highest-Return Input on the Farm." Soil Health Exchange. Published 2025-12-06. https://soilhealthexchange.com/blog/why-soil-testing-is-the-most-cost-effective-decision-in-modern-agriculture.


Discussion
No comments yet. Be the first to share your thoughts!