From CEMA 216 Results to Farm Decisions: SHAPE, Trends, and Advanced Testing
Part 4 of the CEMA 216 Farmer’s Guide: use SHAPE and matched comparisons correctly, investigate conflicting indicators, decide whether PLFA or enzymes are worth the cost, and connect soil-health results to farm outcomes.
SH
By Soil Health Exchange Team||13 min read|44 reads
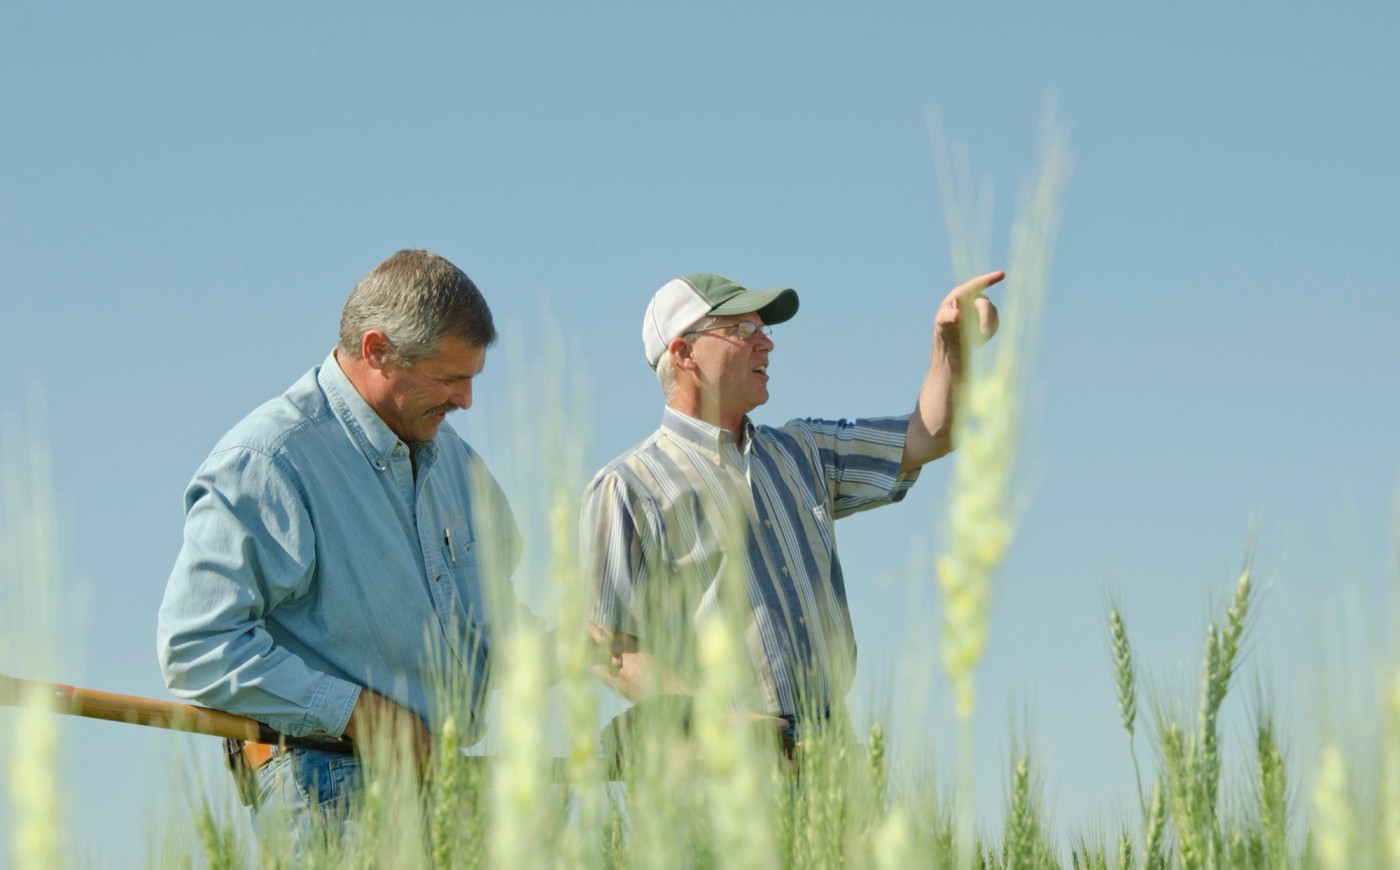
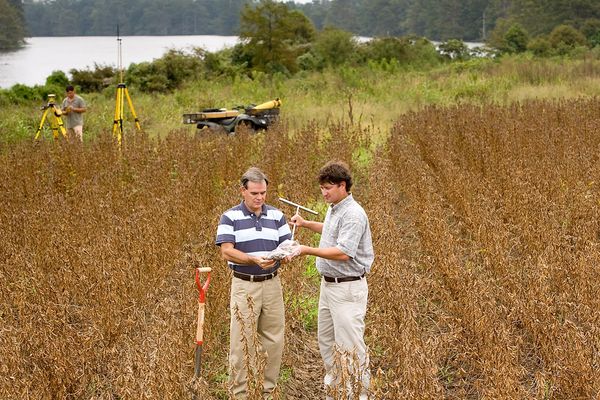
Farmer Mike Zook and NRCS soil scientist Jon Stika discuss soil health in North Dakota. This archival USDA photograph illustrates the kind of field conversation that turns measurements into management decisions. — Credit: USDA Natural Resources Conservation Service (public domain)
Use CEMA 216 results in a structured decision process. Confirm comparability, look for agreement among indicators, apply an appropriate soil-and-climate benchmark, and add field observations and production outcomes. Change management when the combined evidence supports the producer's objective. Diagnosis, yield forecasting, fertilizer rates, and contract evaluation require their own evidence [1][2][3][4].
Version note. This article was checked against the CEMA 216 standard listed by NRCS as “04-2026,” its April 10, 2026 FAQ, and NRCS Technical Note 470-16. Interpretation tools and program guidance continue to develop, so verify the current contract documents and tool version [1][2][3].
Begin with an interpretation audit
Before comparing a bar chart, score, or baseline-to-follow-up percentage, confirm that the underlying records describe the same measurement. CEMA 216 asks the QI to report the sampling strategy, sample IDs, laboratory results, interpretations or observations, and future monitoring schedule. The map must preserve the planning land-unit polygon and WGS84 sampling points [1].
The report-comparability audit
Check
Why it matters
If it changed
Same georeferenced locations and sampling design?
Soil can vary more across a field than across years
Report a new spatial comparison and establish a new baseline
Same depth and collection tool?
Surface stratification and aggregate damage alter results
Separate depth and tool effects from management effects
Same season, crop stage, and similar moisture and weather?
Roots, rainfall, temperature, and moisture affect dynamic indicators
Document the confounder and interpret cautiously
Same recent disturbance and amendment context?
Tillage, fertilizer, manure, compost, and irrigation can create pulses
Separate short-term response from persistent system change
Same laboratory, exact method, incubation, units, and reporting basis?
Each method uses its own analytical scale
End the prior trend and establish a baseline for the new method
Same sample handling and shipping?
Biological assays are sensitive to time and temperature
Ask the laboratory whether the samples remain comparable
Each change limits the strength or type of comparison that the report can support [1][2][3].
Method continuity defines the trend
Switching from POXC to WEOC, ACE protein to WEON, 24-hour to 96-hour respiration, combustion SOC to a loss-on-ignition conversion, or one aggregate-stability protocol to another breaks the direct numeric trend. Record the change and establish a new baseline for the selected method [1][3].
A defensible sequence for reading the report
Preserve the raw records. Keep sample IDs, coordinates, collection date, depth, crop, recent management, laboratory, exact method, units, and reporting basis attached to every value.
Start with texture and pH. Decide which samples are true peers and whether a pH constraint may be influencing roots, nutrient availability, and biological indicators.
Examine the three composites separately. Record the minimum, maximum, spread, and any outlier before calculating a mean.
Ask one functional question at a time. Structure: aggregate stability. Large carbon pool: SOC. Short-term activity: respiration. Responsive carbon pool: POXC or WEOC. Organic-N substrate: ACE protein or WEON.
Choose the comparison before judging the result. Use the same locations over time, a matched management or reference area, or an appropriate modeled peer group.
Connect the laboratory data to field evidence. Add infiltration or ponding, erosion, crusting, rooting, residue cover, trafficability, yield, quality, input cost, and field-operation notes.
Investigate disagreements. Check methods, conditions, texture, pH, and management history before summarizing conflicting signals.
Make the next decision explicit. State what will change, why the evidence supports it, which outcome will be monitored, and when the decision will be revisited.
What a SHAPE score means
SHAPE—Soil Health Assessment Protocol and Evaluation—uses soil texture and soil-suborder groupings, adjusted for historical mean annual temperature and precipitation, to place an indicator within a modeled edaphic-climatic peer-group distribution. The published SHAPE v1 framework includes SOC, two aggregate-stability approaches, POXC, ACE protein, and soil respiration [3][4].
A SHAPE score of 62 places the modeled value around the 62nd percentile for the applicable peer group and climate adjustment. The score expresses peer position; it provides no percent-healthy rating, yield forecast, or economically attainable improvement. A high percentile suggests the measured indicator may be nearer the peer group's observed potential; a lower percentile indicates more apparent opportunity, subject to model uncertainty and peer-group fit [3][4].
SHAPE can estimate 90th-, 95th-, or 99th-percentile benchmarks and an “opportunity gap.” Use these statistical reference points to inform a farm-specific target chosen for the production system, present condition, time horizon, economics, and conservation objective [4].
Use SHAPE for the question it can answer
Reasonable use
Overinterpretation to avoid
Place a supported method within a modeled texture, soil, and climate peer distribution
Call the percentile a universal soil-health grade
Identify indicators with more or less apparent opportunity relative to peers
Assume the highest benchmark is technically or economically achievable
Add context to raw values where local benchmark data are limited
Ignore local management, land use, pH, drainage, or field outcomes
Track a supported indicator with uncertainty and method continuity
Enter WEOC, WEON, PLFA, enzymes, or another method into a curve developed for something else
Combine modeled context with conservation planning and measured farm outcomes [3][4].
The framework is still developing
NRCS and ARS continue collecting soil-health data to improve SHAPE representation and interpretation. Sample sizes vary among peer groups and indicators. Record the model version and uncertainty, and retain the raw laboratory values as the permanent evidence [2][3][4].
How to compare baseline and follow-up
After the comparability audit, calculate change for each georeferenced composite and indicator. Absolute change = follow-up − baseline. Relative change (%) = (follow-up − baseline) ÷ baseline × 100. Absolute change preserves the method's scale; relative change helps discuss indicators with different units. Statistical significance and causation require an appropriate design and analysis.
Illustrative matched-location calculation
Composite
Baseline
Follow-up
Absolute change
Relative change
Location A
31%
38%
+7 percentage points
+22.6%
Location B
34%
41%
+7 percentage points
+20.6%
Location C
36%
44%
+8 percentage points
+22.2%
Hypothetical wet-aggregate-stability values using one laboratory method demonstrate the calculation; CEMA 216 sets no threshold for these values.
The consistency of the three hypothetical paired changes provides more information than two averages. In a real project, the QI should also consider analytical variability, spatial variability, weather, management history, and the monitoring objective. The minimum three composites satisfy the program sampling requirement; stronger scientific claims may require additional replication and analysis.
CEMA 216 sets no improvement threshold
The April 2026 FAQ imposes no statistical improvement threshold for CEMA 216 contract compliance. Interpret a flat or variable final-year result using the methods, conditions, management history, and field outcomes [2].
CEMA and RPP use different compliance measures
CEMA 216 monitors soil indicators without an improvement cutoff. RPP separately requires applicable soil and water resource concerns to reach NRCS planning criteria on the required land unit or land use by contract end. NRCS documents those outcomes through assessment and CART thresholds rather than a required increase in a CEMA laboratory value [6][7]. See Part 1 for the EQIP and CSP scope differences.
Set a realistic time horizon
NRCS Technical Note 470-16 advises allowing roughly three to five years to observe consistent soil-health improvement, and up to ten years in dry regions. Responsive indicators or field outcomes may move sooner, while SOC and structural recovery can be slower. Set expectations according to the indicator, climate, starting condition, and management history [3].
When indicators disagree
Questions raised by conflicting results
Pattern
Possible explanation
Useful follow-up
High respiration, low SOC
A relatively small pool may be cycling rapidly; recent tillage, roots, residue, or amendment may have caused a flush
Check recent operations, labile C, sampling conditions, and the repeated trend
High SOC, low respiration or labile C
Carbon may be relatively protected or resistant; dry, cold, compacted, or unfavorable-pH conditions may constrain activity
Check pH, moisture, rooting or bulk density, residue type, and season
Biological indicators rise, aggregate stability does not
Fast pools may respond before structural recovery, or the physical method may be more variable
Continue matched monitoring and add infiltration, crusting, and erosion observations
One composite differs sharply
A real landscape or management zone, biological hot spot, mislabeled sample, or analytical issue
Inspect coordinates and field notes; contact the laboratory; use a purposeful diagnostic resample if warranted
Follow-up looks better after a method change
The analytical scale changed
Document the method break and establish a comparable baseline
Strong soil-health values, disappointing yield
Weather, fertility, pests, drainage, compaction below the sample, cultivar, or another production constraint
Keep soil-health monitoring separate from a complete crop diagnosis
Use these hypotheses to select follow-up observations or tests [3].
Should you purchase the advanced biology scenario?
Scenario 2 includes every Scenario 1 measurement and adds either PLFA or three enzyme assays selected from the approved list: β-glucosidase for carbon cycling; N-acetyl-β-D-glucosaminidase for carbon and nitrogen; protease for nitrogen; acid and/or alkaline phosphatase for phosphorus; and arylsulfatase for sulfur [1][2].
PLFA versus three enzymes
Route
What it adds
Best-fit question
Main limitation
PLFA
A living-microbial-biomass proxy and broad community groups such as bacteria, fungi, actinomycetes, and an AMF-associated marker
Did broad microbial biomass or community structure differ between matched systems or dates?
Broad-group resolution; strong sensitivity to handling and seasonal conditions
Three enzymes
Potential activity of selected catalysts associated with C, N, P, or S transformations
Does potential functional activity differ for selected nutrient-cycling processes?
Potential laboratory activity requires field evidence for nutrient release, deficiency, or fertilizer decisions
Both routes measure proxies under standardized laboratory conditions. Use the same route and protocol at baseline and follow-up [1][3][5].
What PLFA measures
PLFA measures phospholipid fatty-acid biomarkers associated with living cell membranes. The total serves as a microbial-biomass proxy, and marker patterns estimate broad groups. Because some markers occur in multiple groups, species-level identification, a complete microbiome, direct viability, and named-organism function require other methods [3][5].
NRCS guidance reports limited functional ranges for PLFA and strong sensitivity to moisture, temperature, season, sampling, storage, and shipping. Under comparable conditions, a larger total biomass is generally preferred. Interpret ratios such as fungi:bacteria against the crop, land use, management objective, and local evidence [3][5].
What enzyme assays measure
An enzyme assay measures potential activity under specified laboratory substrate, pH, temperature, and incubation conditions. Higher activity may reflect more microbial biomass, more substrate, or greater organism demand for the associated nutrient. Distinguish among those explanations with field observations and calibrated fertility tests before making nutrient decisions [3].
The advanced-test purchase test
Before paying for Scenario 2, finish this sentence: “If this PLFA or enzyme result is high, low, or unchanged, we will use it to decide ______.” Purchase the advanced scenario when the answer identifies a defensible action, comparison, or monitoring objective. Otherwise, use the standard five-process package [1][3].
Connect indicator patterns to management questions
From signal to conservation-planning conversation
Observed pattern
Management questions to ask
Outcomes to monitor
Weak aggregation plus crusting or runoff
Can disturbance be reduced, cover extended, traffic controlled, roots increased, or organic inputs better retained?
Use these investigation paths to select practices that fit the resource concern, operation, land use, economics, and applicable NRCS standards [1][3].
Keep nutrient management in its calibrated lane
Use regionally calibrated fertility tests and crop-response guidance to determine fertilizer rates. CEMA 217 may be contracted separately, with sampling depth, timing, tools, and locations selected for nutrient-management planning. Use ACE protein, WEON, respiration, enzyme activity, and composite soil-health scores for their defined soil-health questions [2][3].
The mistakes most likely to create a false management signal
Averaging the three composites before inspecting the spread and losing a meaningful landscape or management contrast.
Treating a SHAPE percentile as percent healthy, yield potential, contract compliance, or a mandatory target.
Calculating change across different methods, laboratories, depths, seasons, locations, or handling protocols.
Calling every higher respiration, PLFA, or enzyme value better without checking disturbance, substrate, pH, moisture, and crop stage.
Using a biological indicator as a fertilizer recommendation or a SOC concentration as carbon stock.
Buying PLFA or enzymes without a question the result can answer.
Changing several management practices at once and later claiming one practice caused the laboratory response.
Ignoring yield, quality, input costs, infiltration, erosion, rooting, and field-operability outcomes because a laboratory score improved.
Calling a variable or flat final-year result failure even though CEMA 216 has no statistical improvement threshold for compliance [2].
Final farmer-and-adviser checklist
□ Every value retains its sample ID, coordinates, date, depth, method, units, and reporting basis.
□ Baseline and follow-up passed the location, season, field-condition, laboratory, method, and handling comparability audit.
□ Texture and pH were applied before comparing raw indicator values.
□ The three composites were reviewed separately, and outliers were investigated rather than silently removed.
□ Any SHAPE result uses a supported method and records the tool version, peer context, benchmark, and uncertainty.
□ Absolute and relative changes are labeled as descriptive calculations unless the design supports stronger statistical inference.
□ PLFA or enzyme testing was selected because its result can change a defined decision or monitoring objective.
□ Soil-health patterns were evaluated alongside yield, quality, input cost, erosion, water behavior, roots, cover, and field operations.
□ Fertility and lime decisions use the appropriate regional tests and calibrations.
□ The report ends with a specific next action, outcome measure, responsible person, and monitoring date.
The practical bottom line
CEMA 216 creates value through continuity: a documented question, mapped baseline, standardized methods, interpretation, and return visit. Use the five indicators, SHAPE context, optional advanced biology, field observations, production outcomes, and economics to identify limiting functions, choose management that fits the farm, and monitor the combined soil and production system.
CEMA 216 Part 4: Decisions and Monitoring Knowledge Check
Each attempt draws 8 questions from a 12-question pool and shuffles the answer choices. Score 85% or higher to earn a Certificate of Completion.
1.Before calculating a baseline-to-follow-up trend, which audit is most important?
2.A SHAPE score of 62 is best interpreted as which statement?
3.How should a SHAPE 95th-percentile benchmark or opportunity gap be used?
4.The baseline used POXC, while the follow-up used WEOC. What is the defensible trend conclusion?
5.Aggregate stability rises from 32% to 40% at one matched location. What can the 25% relative increase establish by itself?
6.Which statement correctly separates the CEMA 216 rule from the broader RPP outcome requirement?
7.What time horizon does NRCS Technical Note 470-16 suggest for observing consistent soil-health improvement?
8.Follow-up respiration is high, SOC remains low, and manure was applied shortly before sampling. What is the best interpretation?
SH
Written by
Soil Health Exchange Team
#Cema 216#Shape Soil Health#Soil Health Monitoring#Plfa#Soil Enzymes#Soil Test Trends#Farm Decisions#Soil Health Benchmarks#Nutrient Management#Regenerative Agriculture
Scholarly record
References & Citation
Source material for every claim in this article, plus a citation-ready record for reference managers and scholarly indexes.
Soil Health Exchange Team (2026). From CEMA 216 Results to Farm Decisions: SHAPE, Trends, and Advanced Testing. Soil Health Exchange. https://soilhealthexchange.com/blog/cema-216-results-shape-advanced-testing-farm-decisions
More citation formats
MLA
Soil Health Exchange Team. "From CEMA 216 Results to Farm Decisions: SHAPE, Trends, and Advanced Testing." Soil Health Exchange, 2026-08-08, https://soilhealthexchange.com/blog/cema-216-results-shape-advanced-testing-farm-decisions.
Chicago
Soil Health Exchange Team. "From CEMA 216 Results to Farm Decisions: SHAPE, Trends, and Advanced Testing." Soil Health Exchange. Published 2026-08-08. https://soilhealthexchange.com/blog/cema-216-results-shape-advanced-testing-farm-decisions.


Discussion
No comments yet. Be the first to share your thoughts!