Part 6 - Understanding & Interpreting Soil Health Indicators
The Haney Test: What It Measures and How to Use the Results
By Soil Health Exchange Team - September 18, 2026
Part 6 of our soil health indicator series: how to read a Haney report, distinguish measured indicators from estimated nutrient credits, and use the results for field monitoring, fertilizer decisions, and CEMA 216.
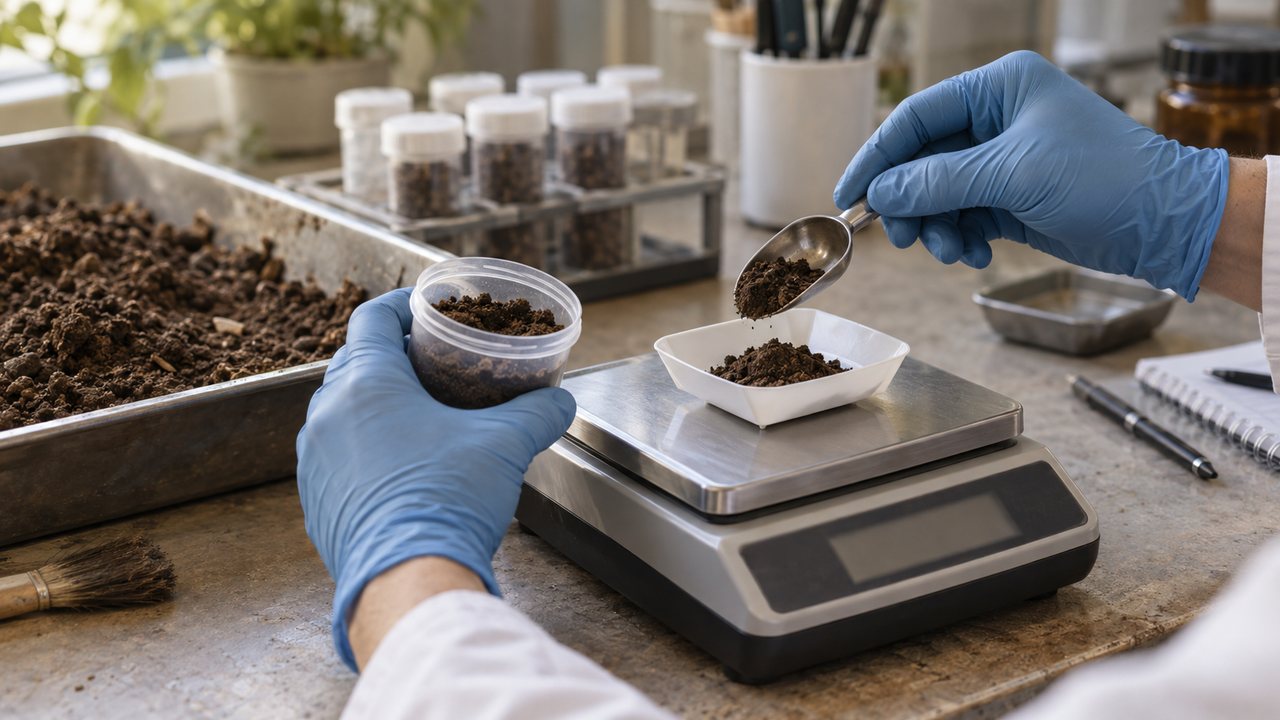
AI-generated editorial illustration of soil sample preparation. The scene does not depict a specific laboratory or the complete Haney test protocol.
Which decision will the test help with?
Are you tracking a management change, planning fertilizer, or ordering tests for a conservation program? Those uses require different evidence. The Haney test can add useful information about biological activity and nutrient cycling, particularly when the same field is sampled consistently over several years. A nutrient credit or a single score needs a separate check before it changes a fertilizer rate [34] [41].
Developed through USDA Agricultural Research Service work in Temple, Texas, the original Soil Health Tool combines a 24-hour CO2 burst, water-extractable organic carbon (WEOC) and nitrogen (WEON), and nutrients extracted with H3A [1]. H3A uses dilute organic acids and has changed since its first publication in 2006; the 2017 H3A-4 formulation removed lithium citrate [2] [3] [4]. The report then uses measured values to calculate a Soil Health Score and estimated nutrient availability. Laboratory packages have also evolved: Ward’s current Soil Health Assessment lists conventional nutrient extracts alongside biological measurements, while Regen Ag Lab’s Haney package lists H3A [51] [52]. Confirm the package contents before comparing reports.
How to read the report
The published 2018 method dries soil at 50 °C, sieves it to 2 mm, and uses separate water and H3A extracts plus a dried-and-rewetted sample for respiration [1]. Incubation and detection methods can differ: Ward’s archived instructions specify infrared CO2 analysis at 24 °C, while MVTL’s information sheet specifies 25 °C [5] [6]. WEON is calculated as total water-extractable N minus nitrate-N and ammonium-N. It is an estimate of an extractable organic pool, not a direct measurement of the N a crop will receive.
The lines on a Haney report and what each one is
Report line
How it is produced
What it can tell you
Interpretation boundary
1-day CO2-C, usually mg C/kg soil (ppm)
CO2-C released during a 24-hour incubation of dried, rewetted soil [1] [5]
Potential microbial activity under the test conditions
A respiration indicator, not a direct microbial count or field CO2 flux. Compare the same incubation and rewetting method.
WEOC, ppm
Organic carbon in the water extract [1]
A water-extractable carbon fraction relevant to microbial activity
It is not total soil organic carbon. Ward reports that many samples fall around 100-300 ppm; this is a laboratory observation, not a universal target [7].
WEON, ppm
Total water-extractable N minus nitrate-N and ammonium-N [5]
An organic N fraction used in the nutrient-credit calculation
The pool size does not establish how much N will mineralize during the growing season.
Water-extract organic C:N
WEOC divided by WEON [7]
The balance of C and N in this extract
It differs from whole-soil or residue C:N. Archived Ward guidance assigns no N or P mineralization credit above 20:1; this is a calculation rule, not a universal field threshold [5].
Which score formula was used? Published documents are not uniform. The 2018 paper prints (CO2-C/10) × (WEOC/100) × (WEON/10) [1]. Ward’s archived information sheet prints CO2-C/10 + WEOC/50 + WEON/10 [5]; its report-definitions sheet describes respiration divided by organic C:N plus weighted WEOC and WEON [8]. These documents establish a version issue, not which formula every laboratory uses today. Ask the laboratory to identify its current calculation and whether older results can be recalculated before treating a score change as a management response.
The nutrient calculation also has assumptions. In the 2018 paper, potential N mineralization equals the CO2-C:WEOC fraction × WEON × 2.24 × n, where n represents growing-season rain or irrigation events greater than one inch; the paper suggests four as a starting value [1]. Its available-N equation uses 2.24 to convert ammonium-N from mg/kg to kg/ha and 1.6 for nitrate-N, with the latter incorporating an assumed 30% nitrate loss. The 1.6 factor is therefore not a simple increase in measured nitrate. Laboratory guidance may implement credits differently [7]. The biological rationale draws on several studies; the 2008 compost experiment on Houston Black clay is one example, not the entire evidence base [1] [9]. These relationships still need field validation for the crop, region, and recommendation being used.
What have field studies found?
Studies have evaluated several different questions: whether indicators respond to management, whether a score tracks yield, and whether a nutrient recommendation predicts fertilizer response. Success on one question does not settle the others. The studies below show useful biological signals alongside limits in consistency and regional calibration.
Selected evaluations of Haney indicators and related methods, 2016-2025
Study
Where and how
What it found
Morrow et al. 2016 [10]
Five long-term trials, inland Pacific Northwest, 2-30 years old
1-day C mineralization and the Haney index were highly variable (coefficients of variation up to 53% and 37%) and consequently not very sensitive to tillage or cropping intensity; POX-C scored best on the authors' seven criteria
Roper et al. 2017 [11]
Three North Carolina trials with 17-32 years of contrasting management
The Haney test rated soil from every system except moldboard plowing as in good health; Cornell CASH rated the same mountain soils low or very low except the no-till organic system, which scored medium; neither test correlated with crop yield
Haney, Solvita, and SLAN results were inconsistent between years in detecting cover crop effects and in their relationships with yield, soil organic carbon, and a 2-day C-mineralization test.
Yost et al. 2018 [13]
17 corn N-rate trials in eight Midwest states, one season (2016)
The N recommendation with expected yield explained at most 28% of variation in economically optimum N rate. The score and CO2 burst each explained about 55%; the two were strongly related (R-squared 0.98).
Chu et al. 2019 [14]
No-till corn-soybean cover crop trial established 2013, west Tennessee
Management sensitivity was inconsistent in several trials [10] [11] [12] [16]. Nebraska provides a useful positive result: water-extract and H3A nitrogen measurements detected treatment differences missed by conventional nitrate testing, with similar analytical precision [15]. The North Carolina results also prompted a published disagreement about the Cornell CASH indicators [21] [22]. That reanalysis focused on CASH, so its conclusions should not be transferred to the Haney score. For a farm, the relevant question is whether the selected indicator can detect the particular change being monitored.
The North American Project to Evaluate Soil Health Measurements provides broader support for respiration as a monitoring indicator [17] [18]. Its recommended minimum suite combines soil organic carbon, aggregate stability, and 24-hour carbon mineralization. WEOC also responded to management, but overlapped with other carbon measurements [17] [23]. The project’s nitrogen analysis found strong relationships with carbon indicators and suggested organic carbon plus respiration as proxies for N-supply function [24]. This does not supply a field-specific fertilizer credit or validate the Haney score. A separate synthesis of 1,071 samples found that short-term mineralizable carbon and POX-C reflected different aspects of organic matter cycling, supporting their use as complementary indicators [25].
Can respiration help estimate nitrogen need? Research in North Carolina and Virginia found promising relationships between a 3-day CO2 flush and corn response to N [26] [27]. A later analysis across 111 fields explained 46% of variation in yield-scaled optimum N [28]. That method differs from the 24-hour Haney protocol in incubation duration, soil preparation, and rewetting. Its equations and thresholds should not be applied directly to a Haney report. In 29 Corn Belt N-rate trials, better biological soil health was associated with higher yield per unit of N, but the indicators offered limited advance information about a site’s fertilizer response [29].
Method consistency matters. A developer study found strong correlations among Solvita, titration, and infrared CO2 measurements, but correlation does not make their values interchangeable [30]. The manufacturer’s laboratory comparison found substantial effects of rewetting method [31], and an independent study found high between-laboratory variability in mineralizable carbon [32]. NRCS guidance has also evolved since its 2019 technical note [33]; the 2025 note discusses respiration methods lasting one to four days [34]. Keep the method fixed when monitoring, and check with the laboratory before combining results from different protocols. Part 5 explains these differences.
How should the field be sampled?
Build the sampling plan before ordering. Purdue and NRCS recommend consistent locations, depth, seasonal timing, and laboratory methods for repeated comparisons [35] [34]. Record crop, recent tillage and inputs, weather, and soil conditions. Consistency helps distinguish management effects from sampling variation; analytical precision still matters.
Confirm the depth and sampling design. Ward’s archived Haney protocol specifies 10-15 cores at 0-6 or 0-8 inches for its fertility recommendations [36]. Regen Ag Lab asks for at least ten cores collected at a consistent depth [37]. These are laboratory examples; CEMA 216 has a separate sampling design [38] [48]. Keep different depths separate and use the depth required for the intended interpretation.
Read a pounds-per-acre credit with its assumptions. Ward’s archived conversion is sample depth in inches × 0.3 × the estimated organic-N-release value in ppm [7]. An estimated release of 30 ppm therefore converts to 54 lb N/acre at six inches or 72 lb at eight inches. This illustrates the report’s arithmetic, not a reason to change sampling depth or a measurement of actual crop N supply.
Choose suitable field conditions. Avoid extreme wetness, dryness, or temperature, and recent tillage, amendments, or fertilizer unless the sampling design specifically addresses them [38] [39]. Regen Ag Lab recommends soil at least 50 °F [37]. Confirm timing with the receiving laboratory and record departures from the plan.
Keep samples cool and ship promptly. Laboratory drying and rewetting does not make field handling irrelevant. Follow the receiving laboratory’s storage, shipping, and holding-time instructions [37] [40]. For CEMA 216, obtain the protocol before collection; the current standard calls for cooler or refrigerator storage when samples are not sent immediately, and additional precautions for PLFA [38].
Choose a repeat interval that serves the question. Annual sampling can build a useful record, but a one-year difference is not enough to establish a management trend. NRCS suggests allowing three to five years, or longer in dry regions, to observe consistent improvement [34]. Purdue discusses a two-year testing interval [35]; program or research requirements may call for more frequent testing, including annual CEMA 216 sampling [48].
Can the nutrient lines support a fertilizer decision?
First identify how the laboratory calculated the credit. Ward’s archived guidance bases organic-N release on the water-extract C:N ratio, respiration, and WEON pool, and caps the credit at the measured WEON pool [7]. Its older information sheet assigns no N or P mineralization credit above a 20:1 water-extract C:N ratio [5]. These are model rules. A line labeled “nitrogen savings” expresses an estimated difference from a nitrate-only calculation; it does not establish realized savings or maintained yield [5].
The 17-site, eight-state corn study found that the Haney N recommendation with expected yield explained at most 28% of variation in economically optimum N rate; the score and CO2 burst each explained about 55% [13]. That supports further investigation of the indicators, while leaving substantial uncertainty in a rate decision. Minnesota Extension also reports cases where Haney recommendations would have increased N rates relative to its guidelines, and advises against using soil health tests alone to determine fertilizer rates [41] [42]. NRCS likewise cautions against using soil health package results for nutrient management planning [34]. If a package includes conventional fertility analyses, confirm that their methods, sampling, and interpretation meet the applicable local guidance.
If a Haney-based N rate would change management, compare it with the locally recommended rate in small, replicated strips before extending it across the farm [43]. Record applied N, yield, and net return with an agronomist. Where locally validated, a pre-sidedress nitrate test can inform an in-season corn decision. A late-season stalk nitrate test answers a different question: it helps assess the season’s N management after most fertilizer decisions have already been made [37]. Neither is interchangeable with a crop-response trial.
For phosphorus and potassium, extraction method is central. Kansas and Tennessee comparisons found that H3A and Mehlich-3 values were related, but conversion errors were too large to transfer existing fertilizer calibrations reliably [44] [45]. Iowa researchers tested H3A phosphorus against crop response and found weaker relationships than for Bray-1 and Mehlich-3 in those trials [46]. This is evidence for using method-specific, regional calibration; it does not show that H3A can never be calibrated. Wisconsin Extension makes the same practical distinction between measuring a nutrient and establishing a fertilizer recommendation [47].
H3A versus the calibrated extractant: what three states found
Study
Soils
H3A compared with Mehlich-3 (or routine tests)
Authors' conclusion
Rutter & Ruiz Diaz 2020 [45]
Kansas
r = 0.90 (P) and 0.91 (K); Mehlich-3 extracted about 25% more P and 250% more K; RMSE 15.4 ppm P, 83.4 ppm K
Errors too large to plug H3A values into existing Kansas calibrations
Adotey et al. 2025 [44]
Tennessee
R-squared 0.87 (P) and 0.39 (K); Mehlich-3 extracted about 60% more P and 25% more K
Inappropriate to estimate Mehlich-3 P and K from H3A-4 for fertilizer recommendations
Mallarino & Jones 2018 [46]
Iowa, 24 sites, 54 corn and 58 soybean site-years
R-squared 0.94-0.95 with Bray-1 and Mehlich-3, 0.97 with Olsen; yield-response model R-squared 0.33-0.40 (H3A) vs 0.60-0.73 (Bray-1, Mehlich-3)
H3A needs its own field calibration; preliminary critical ranges 12-16 ppm corn, 14-19 ppm soybean
Correlation between extractants does not establish equivalent fertilizer recommendations. The Iowa study supplies preliminary phosphorus calibration evidence for its soils and crops; it does not establish a national H3A interpretation or a potassium calibration.
Does the package meet CEMA 216 requirements?
Check the current standard and job aid with the Qualified Individual (QI) before ordering. The national documents listed by NRCS as 04-2026 require tests for five processes: aggregation, carbon cycling, microbial activity, carbon food source, and nitrogen food source, plus pH and texture [38] [61]. The standard lists WEOC and WEON as alternate methods for the two food-source categories; the April 10, 2026 FAQ explicitly explains their connection to the Haney method [48]. A 24-hour respiration test can address microbial activity. The Soil Health Score and H3A nutrient credits do not substitute for the required analyses.
A Haney package may therefore supply several required measurements, but the name alone does not establish compliance. Confirm aggregate stability, the accepted organic-carbon method, texture, pH, and every other required method on the actual order. The QI must also arrange the pre-work conference and meet sampling and reporting requirements [38] [61]. The FAQ describes an instance as three separate composite samples, each made from five subsamples, and estimates about $150 per sample before shipping [48]. Confirm the current laboratory qualifications and contracted requirements with the local NRCS office. SHE’s CEMA 216 guide covers the full workflow.
What does the price include?
Compare package contents as well as price. Regen Ag Lab lists its Haney package at $60, while Ward lists a $61.90 Soil Health Assessment with different nutrient extraction methods [52] [51]. The examples below were checked on September 17, 2026. Prices, turnaround, and package contents can change; request the current specification before ordering.
Examples of soil-testing options and posted prices
Test or package
What it adds
Useful decision or question
Posted price per sample
Haney package
Respiration, water-extractable C and N, H3A nutrients, and calculated indicators
Monitor biological indicators and investigate nutrient cycling
$60 Regen Ag Lab, schedule effective Jan. 1, 2025 [52]; $65 Midwest Labs Soil Health Complete, including conventional S3C fertility analyses, undated [53]
Ward Soil Health Assessment
Respiration and water-extractable C/N; conventional nutrient extracts; modified aggregate stability
Combine biological monitoring with the listed chemical and physical measurements
$61.90, effective Jan. 1, 2026. The current listing specifies Mehlich-3 P and ammonium-acetate cations, rather than H3A [51]
Routine fertility panel
pH, extractable nutrients, and other analyses depending on package
Locally calibrated lime and fertilizer decisions
$17.35 S-1 to $23.65 S-4 at Ward; organic matter is not included in S-1 [51]. Midwest S1A $9.77 and S3C $26.78 without recommendations; $11.03 and $27.83 with recommendations [53]
24-h CO2 burst alone
The respiration line only
Track potential microbial activity with a consistent protocol
Five interpretation checks
Is the comparison fair? Soil, climate, and management history influence indicator values. Use comparable sampling areas and methods rather than ranking unrelated farms by raw scores [7]. Cornell’s framework uses texture groups for selected indicators, but a scoring framework still needs regional context [58] [59].
Is there a sustained change? Compare several observations and their sampling records. A single increase or decrease can reflect season, weather, or recent inputs [19] [35].
Does the score answer the farm question? A management-sensitive indicator is not automatically a yield predictor. North Carolina trials found limited discrimination among some long-term systems and no correlation between the tested soil health assessments and yield [11] [59]. Keep crop performance and field observations alongside the laboratory record.
What has not been measured? The core Haney indicators do not directly measure infiltration, bulk density, or water-holding capacity [7]. Use field observations and targeted measurements to investigate rooting, compaction, and water movement [34]. Distinguish inherent context, such as texture, from management-responsive conditions, such as pH.
Whose benchmark is being used? Ward’s archived “above 7” guidance is a laboratory interpretation, not a universal pass mark [5] [7]. Purdue notes that the Haney calculation has no defined “high” threshold [35]. A nearby perennial reference area can provide context when soil and landscape position are comparable, but it is not automatically an attainable cropping-system target [60] [34].
Before the next sample
Write down the decision the test should support, then confirm the laboratory’s package, methods, and handling instructions. Save the component results and score formula with the sampling record. If the report suggests a different fertilizer rate, review its local evidence with an agronomist and plan a field comparison. On the next sampling round, return to comparable locations and conditions so the record becomes more useful over time.
Sources
Haney, R.L., Haney, E.B., Smith, D.R., Harmel, R.D., White, M.J. (2018). The soil health tool - Theory and initial broad-scale application. Applied Soil Ecology 125:162-168. https://doi.org/10.1016/j.apsoil.2017.07.035 (open-access author proof consulted; the score equation as printed in the proof is described in the text)https://solvita.com/wp-content/uploads/2018/03/The-Soil-Health-Tool_Theory-and-initial-broad-scale-application_Haney-et-al_App-Soil-Eco_2017-07-035.pdf
Haney, R.L., Haney, E.B., Hossner, L.R., Arnold, J.G. (2010). Modifications to the New Soil Extractant H3A-1: A Multinutrient Extractant. Communications in Soil Science and Plant Analysis 41(12):1513-1523. https://doi.org/10.1080/00103624.2010.482173https://doi.org/10.1080/00103624.2010.482173
Haney, R.L., Haney, E.B., Hossner, L.R., Arnold, J.G. (2006). Development of a new soil extractant for simultaneous phosphorus, ammonium, and nitrate analysis. Communications in Soil Science and Plant Analysis 37:1511-1523. (USDA-ARS publication record and abstract consulted)https://www.ars.usda.gov/research/publications/publication/?seqNo115=181325
Haney, R.L., Haney, E.B., Smith, D.R., White, M.J. (2017). Removal of lithium citrate from H3A for determination of plant available P. Open Journal of Soil Science 7:301-314. (USDA-ARS publication record consulted)https://www.ars.usda.gov/research/publications/publication/?seqNo115=345545
Ward Laboratories, Inc. Haney / Soil Health Test Information, Rev. 1.0. Archived document at a 2019 upload URL; not a specification for the current package.https://www.wardlab.com/wp-content/uploads/2019/09/Haney-Rev-1.0-Information.pdf
Minnesota Valley Testing Laboratories. Haney—Soil Health Test Information. Undated document at a June 2025 upload URL.https://mvtl.com/wp-content/uploads/2025/06/Haney.pdf
Ward Laboratories, Inc. Haney Test Interpretation Guide v1.0. Archived laboratory guidance; ranges and rankings are observations rather than regional crop-response calibrations.https://www.wardlab.com/wp-content/uploads/2020/02/Haney-Rev-1.0-Interpretation-Guide-PDF-1.pdf
Citation
Soil Health Exchange Team (2026). The Haney Test: What It Measures and How to Use the Results. Soil Health Exchange. https://soilhealthexchange.com/blog/haney-soil-health-test-what-it-measures
An index relating respiration to water-extractable carbon
The two values come from separate analyses. The ratio does not directly measure the fraction of the extracted carbon consumed by microbes.
H3A nutrients, where included
Nutrients extracted with the H3A solution [1]
Nutrient concentrations under that extraction method
Use H3A-specific interpretation. Do not apply Mehlich-3, Bray, Olsen, or ammonium-acetate thresholds directly [44] [45].
Soil Health Score / Soil Health Calculation
Formula combining respiration, WEOC, and WEON [1] [5] [8]
A composite indicator for context and monitoring
Check the formula version. A higher score alone does not establish higher yield or lower fertilizer need.
Available N-P-K, N credit, fertilizer recommendation
Measured nutrient fractions combined with model assumptions and crop information [1] [7]
The laboratory’s estimated nutrient supply and proposed rate
Ask which equations, depth conversion, yield assumptions, and regional field calibrations support the recommendation.
The original Haney method and current commercial packages are not necessarily identical. Retain the laboratory, method, units, sampling depth, and report version with each result.
H3A extracted the least P, K, Ca and Mg of three extractants; neither the score nor any component detected a cover crop effect; the Solvita CO2 value did not reliably estimate potentially mineralizable N
Bavougian et al. 2019 [15]
Long-term tillage x rotation x N-rate trial, northeast Nebraska
The H3A and water-extract N tests detected more treatment differences than conventional nitrate and had similar precision; high N and intensive tillage mostly gave low burst and score values; yields were generally not correlated with the indicators
Haney indicators, both score versions and N mineralization responded inconsistently to management; the score was driven mostly by WEON; H3A nutrients were more variable than Mehlich-1
Bagnall et al. 2023, NAPESHM [17] [18]
NAPESHM: 124 long-term North American sites; more than 30 measurements considered across the project
Recommended soil organic carbon, aggregate stability, and 24-hour C mineralization as a minimum suite. The minimum-suite analysis did not directly evaluate the Haney score or H3A nutrient recommendations.
Sherbine et al. 2023 [19]
Minnesota cropland, two years of seasonal sampling after tile drainage
No detectable response to recent drainage installation during the study; the biological indices varied with season and year, with the highest values in spring.
Hu et al. 2025 [20]
Eight sites in northeastern Colorado: seven dryland cropped fields and one pasture
The score was strongly related to the CO2 burst (r = 0.82). Estimated mineralizable N was not related to the 28-day incubation result (R-squared below 0.01). The pasture had the highest score under both assessment frameworks.
These are study-specific findings, not a pooled estimate of test performance. Most study summaries are based on published abstracts; the NAPESHM minimum-suite paper was checked in full. Methods, score versions, soils, and management histories differ.
$29.70 Ward, 2026 [51]; $25 Regen Ag Lab, individual-test list dated Aug. 28, 2025 [52]
POX-C (active carbon)
Permanganate-oxidizable carbon
Track a management-sensitive carbon fraction; an approved CEMA 216 method
Estimate broad microbial groups and biomass; it does not directly measure their field functions
$100.95 Ward, 2026 [51]; $90 Regen, 2025 [52]
Cornell CASH
Physical, biological, and chemical indicators; selected scores adjusted for texture
Assess several soil functions using the framework’s reference groups; interpret regional fit
Basic $100, Standard $140, Standard PLUS $160; 5 cups; typical turnaround 4-8 weeks. Standard predicts ACE protein; Standard PLUS measures it [55] [56]
CEMA 216 core package
The five required processes plus pH and texture
NRCS cost-shared baseline and follow-up testing
$149.50 Ward [50] [51]; $180 Cornell [55]; $150 UVM [57]. The March 2026 MCCC compilation has differing contents; its $93.01-$103.01 entry excludes aggregate stability [49].
These are laboratory fees, not total sampling or professional-service costs. CEMA 216 package names and quoted prices do not establish that a particular order meets all requirements. Confirm methods, added fees, sample volume, and turnaround.
Ward Laboratories, Inc. Haney Report Definitions. Archived document at a 2019 upload URL.
Haney, R.L., Brinton, W.H., Evans, E. (2008). Estimating Soil Carbon, Nitrogen, and Phosphorus Mineralization from Short-Term Carbon Dioxide Respiration. Communications in Soil Science and Plant Analysis 39(17-18):2706-2720. https://doi.org/10.1080/00103620802358862https://mssoy.org/sites/default/files/documents/haney-test.pdf
Morrow, J.G., Huggins, D.R., Carpenter-Boggs, L.A., Reganold, J.P. (2016). Evaluating Measures to Assess Soil Health in Long-Term Agroecosystem Trials. Soil Science Society of America Journal 80(2):450-462. https://doi.org/10.2136/sssaj2015.08.0308 (abstract consulted)https://doi.org/10.2136/sssaj2015.08.0308
Roper, W.R., Osmond, D.L., Heitman, J.L., Wagger, M.G., Reberg-Horton, S.C. (2017). Soil Health Indicators Do Not Differentiate among Agronomic Management Systems in North Carolina Soils. Soil Science Society of America Journal 81:828-843. https://doi.org/10.2136/sssaj2016.12.0400 (abstract consulted; full text paywalled) Associated erratum: https://doi.org/10.2136/sssaj2016.12.0400er (Table 7 yield-unit label and acknowledgment corrected; no change to the conclusions summarized here).https://doi.org/10.2136/sssaj2016.12.0400
Chahal, I., Van Eerd, L.L. (2018). Evaluation of commercial soil health tests using a medium-term cover crop experiment in a humid, temperate climate. Plant and Soil 427:351-367. https://doi.org/10.1007/s11104-018-3653-2 (published abstract consulted)https://doi.org/10.1007/s11104-018-3653-2
Yost, M.A., Veum, K.S., Kitchen, N.R., Sawyer, J.E., Camberato, J.J., Carter, P.R., Ferguson, R.B., Fernandez, F.G., Franzen, D.W., Laboski, C.A., Nafziger, E.D. (2018). Evaluation of the Haney Soil Health Tool for corn nitrogen recommendations across eight Midwest states. Journal of Soil and Water Conservation 73(5):587-592. https://doi.org/10.2489/jswc.73.5.587 (USDA-ARS publication record and abstract consulted)https://www.ars.usda.gov/research/publications/publication/?seqNo115=345992
Chu, M., Singh, S., Walker, F.R., Eash, N.S., Buschermohle, M.J., Duncan, L.A., Jagadamma, S. (2019). Soil Health and Soil Fertility Assessment by the Haney Soil Health Test in an Agricultural Soil in West Tennessee. Communications in Soil Science and Plant Analysis 50(9):1123-1131. https://doi.org/10.1080/00103624.2019.1604731 (abstract consulted)https://doi.org/10.1080/00103624.2019.1604731
Bavougian, C.M., Shapiro, C.A., Stewart, Z.P., Eskridge, K.M. (2019). Comparing Biological and Conventional Chemical Soil Tests in Long-Term Tillage, Rotation, N Rate Field Study. Soil Science Society of America Journal 83:419-428. https://doi.org/10.2136/sssaj2018.06.0240 (abstract consulted)https://doi.org/10.2136/sssaj2018.06.0240
Singh, S., Jagadamma, S., Yoder, D.C., Yin, X., Walker, F. (2020). Agroecosystem management responses to Haney soil health test in the southeastern United States. Soil Science Society of America Journal 84:1705-1721. https://doi.org/10.1002/saj2.20131 (abstract consulted)https://doi.org/10.1002/saj2.20131
Bagnall, D.K., Rieke, E.L., Morgan, C.L.S., Liptzin, D.L., Cappellazzi, S.B., Honeycutt, C.W. (2023). A minimum suite of soil health indicators for North American agriculture. Soil Security 10:100084. https://doi.org/10.1016/j.soisec.2023.100084https://agrilifeorganic.org/wp-content/uploads/2024/08/soil-health-measurements-8.10.24.pdf
Norris, C.E., Mac Bean, G., Cappellazzi, S.B., Cope, M., Greub, K.L.H., Liptzin, D., Rieke, E.L., Tracy, P.W., Morgan, C.L.S., Honeycutt, C.W. (2020). Introducing the North American project to evaluate soil health measurements. Agronomy Journal 112:3195-3215. https://doi.org/10.1002/agj2.20234https://doi.org/10.1002/agj2.20234
Sherbine, K., Frankl, A., Fernandez, F.G., Pease, L., Cates, A.M. (2023). Haney Soil Health Test changes with season, not subsurface drainage. Agricultural & Environmental Letters 8(1): e20098. https://doi.org/10.1002/ael2.20098 (publisher abstract and methods consulted)https://doi.org/10.1002/ael2.20098
Hu, X., Machmuller, M.B., Blecker, S.W., Buchanan, C.M., Aksland, I.B., Firth, A.G., Ippolito, J.A. (2025). Comparing the Soil Management Assessment Framework to the Haney Soil Health Test Across Managed Agroecosystems. Agronomy 15(3):643. https://doi.org/10.3390/agronomy15030643 (abstract consulted)https://doi.org/10.3390/agronomy15030643
Roper, W.R., Osmond, D.L., Heitman, J.L. (2019). A Response to 'Reanalysis Validates Soil Health Indicator Sensitivity and Correlation with Long-term Crop Yields'. Soil Science Society of America Journal 83(6):1842-1845. https://doi.org/10.2136/sssaj2019.06.0198 (abstract consulted)https://doi.org/10.2136/sssaj2019.06.0198
van Es, H.M., Karlen, D.L. (2019). Reanalysis Validates Soil Health Indicator Sensitivity and Correlation with Long-term Crop Yields. Soil Science Society of America Journal 83(3):721-732. https://doi.org/10.2136/sssaj2018.09.0338https://doi.org/10.2136/sssaj2018.09.0338
Liptzin, D., Norris, C.E., Cappellazzi, S.B., et al. (2022). An evaluation of carbon indicators of soil health in long-term agricultural experiments. Soil Biology and Biochemistry 172:108708. https://doi.org/10.1016/j.soilbio.2022.108708 (abstract consulted)https://doi.org/10.1016/j.soilbio.2022.108708
Liptzin, D., Rieke, E.L., Cappellazzi, S.B., et al. (2023). An evaluation of nitrogen indicators for soil health in long-term agricultural experiments. Soil Science Society of America Journal 87:868-884. https://doi.org/10.1002/saj2.20558 (abstract consulted)https://doi.org/10.1002/saj2.20558
Hurisso, T.T., Culman, S.W., Horwath, W.R., Wade, J., Cass, D., Beniston, J.W., Bowles, T.M., Grandy, A.S., Franzluebbers, A.J., Schipanski, M.E., Lucas, S.T., Ugarte, C.M. (2016). Comparison of Permanganate-Oxidizable Carbon and Mineralizable Carbon for Assessment of Organic Matter Stabilization and Mineralization. Soil Science Society of America Journal 80:1352-1364. https://doi.org/10.2136/sssaj2016.04.0106https://doi.org/10.2136/sssaj2016.04.0106
Franzluebbers, A.J. (2018). Soil-Test Biological Activity with the Flush of CO2: III. Corn Yield Responses to Applied Nitrogen. Soil Science Society of America Journal 82:708-721. https://doi.org/10.2136/sssaj2018.01.0029https://doi.org/10.2136/sssaj2018.01.0029
Franzluebbers, A.J. (2020). Soil-test biological activity with the flush of CO2: V. Validation of nitrogen prediction for corn production. Agronomy Journal 112:2188-2204. https://doi.org/10.1002/agj2.20094 (abstract consulted)https://doi.org/10.1002/agj2.20094
Wade, J., Culman, S.W., Logan, J.A.R., Poffenbarger, H., Demyan, M.S., Grove, J.H., Mallarino, A.P., McGrath, J.M., Ruark, M., West, J.R. (2020). Improved soil biological health increases corn grain yield in N fertilized systems across the Corn Belt. Scientific Reports 10:3917. https://doi.org/10.1038/s41598-020-60987-3https://doi.org/10.1038/s41598-020-60987-3
Haney, R.L., Brinton, W.F., Evans, E. (2008). Soil CO2 respiration: Comparison of chemical titration, CO2 IRGA analysis and the Solvita gel system. Renewable Agriculture and Food Systems 23(2):171-176. https://doi.org/10.1017/S174217050800224X (developer and manufacturer authors)https://doi.org/10.1017/S174217050800224X
Brinton, W. (2016). Proficiency results on Solvita CO2-Burst and SLAN tests for soil testing laboratories participating in 2016 QC soil trial. Woods End Laboratories / Solvita. (Manufacturer's own inter-laboratory report.)https://solvita.com/wp-content/uploads/2018/04/QAQC-BRINTON-PUBLIC-FINAL-REV1.pdf
Wade, J., Culman, S.W., Hurisso, T.T., Miller, R.O., Baker, L., Horwath, W.R. (2018). Sources of Variability that Compromise Mineralizable Carbon as a Soil Health Indicator. Soil Science Society of America Journal 82(1):243-252. https://doi.org/10.2136/sssaj2017.03.0105 (abstract consulted)https://doi.org/10.2136/sssaj2017.03.0105
Stott, D.E. (2019). Recommended Soil Health Indicators and Associated Laboratory Procedures. Soil Health Technical Note No. 450-03. USDA Natural Resources Conservation Service. (Superseded by Technical Note 470-16 in 2025.)https://www.soils.org/files/napt/publications/method-papers/2019-nrcs-technote-450-03.pdf
USDA-NRCS Soil Health Division (2025, May). Soil Health Technical Note No. 470-16: Soil Health Testing to Support Conservation Planning.https://directives.nrcs.usda.gov/sites/default/files2/1748890495/TN%20470-16%20Soil%20Health%20Testing%20to%20Support%20Conservation%20Planning.pdf
Zuber, S.M., Kladivko, E.J. (2018, June). How to Understand and Interpret Soil Health Tests. Purdue Extension AY-366-W.https://www.extension.purdue.edu/extmedia/ay/ay-366-w.pdf
Ward Laboratories, Inc. (2019). Haney Test Sampling Information (H3A).https://www.wardlab.com/wp-content/uploads/2019/09/Haney-Test-Sampling-Information.pdf
Regen Ag Lab, LLC. Sampling Instructions, Soil Health Sampling section.https://regenaglab.com/sampling-instructions/
USDA Natural Resources Conservation Service. Soil Health Testing, CEMA 216. National standard listed as 04-2026; PDF page header reads January 2026R. Checked September 17, 2026.https://www.nrcs.usda.gov/sites/default/files/2026-05/CEMA%20216%20SoilHealth%20Testing%2004-2026.pdf
Hoffman, O., Ippolito, J., Rakkar, M. Soil Health Testing. Ohio State University Extension. Current fact sheet, checked September 17, 2026.https://cfaes-contenthub.org.ohio-state.edu/fact-sheet/soil-health-testing
Ward Laboratories, Inc. Submit a Soil Sample (sample handling and shipping guidance).https://www.wardlab.com/how-to/submit-a-soil-sample/
Stahl, L., Fernandez, F.G., Kaiser, D.E. (reviewed 2018). Can soil health tests determine fertilizer needs? University of Minnesota Extension.https://extension.umn.edu/soil-management-and-health/can-soil-health-tests-determine-fertilizer-needs
Cates, A. (2024, January 1; originally published May 2020). 5 things to know about the Haney soil health test. University of Minnesota Extension Crop News.https://blog-crop-news.extension.umn.edu/2020/05/5-things-to-know-about-haney-soil.html
Ohio State University Extension, Agronomic Crops Network (2019). The Haney Test for Soil Health. C.O.R.N. Newsletter 2019-07.https://agcrops.osu.edu/newsletter/corn-newsletter/2019-07/haney-test-soil-health
Adotey, N., Yin, F., Florence, R., Blair, R. (2025, February 18). Does Soil Test Phosphorus and Potassium Values from Haney Soil Health Test (H3A-4) Translate to Mehlich-3? UT Crops News, University of Tennessee.https://news.utcrops.com/2025/02/does-soil-test-phosphorus-and-potassium-values-from-haney-soil-health-test-h3a-4-translate-to-mehlich-3/
Rutter, E.B., Ruiz Diaz, D.A. (2020). Relationships between the Haney H3A and Conventional Soil Tests for Phosphorus and Potassium in Kansas Soils. Kansas Agricultural Experiment Station Research Reports 6(9). https://doi.org/10.4148/2378-5977.7979 (abstract consulted)https://doi.org/10.4148/2378-5977.7979
Mallarino, A.P., Jones, J.D. (2018). Correlation of the Weak Organic Acids Test of a Soil Health Tool with Crop Yield Response to Phosphorus Fertilization. North Central Extension-Industry Soil Fertility Conference, Vol. 34, Des Moines, IA. Iowa State University.https://www.agronext.iastate.edu/soilfertility/info/Mallarino-Jones%20Soil%20health%20P%20test%20Proceed%20NC%20Soil%20Fert%20Conf%202018.pdf
UW-Madison Extension Crops & Soils. Field Notes Episode 17: Interpreting the Haney Test for Wisconsin (transcript; Bandura, Jones and Stammer quoted).https://cropsandsoils.extension.wisc.edu/articles/field-notes-episode-17-interpreting-the-haney-test-for-wisconsin
USDA Natural Resources Conservation Service (2026, April 10). FAQs for CEMA 216 Soil Health Testing, Regenerative Pilot Program.https://www.nrcs.usda.gov/sites/default/files/2026-04/CEMA%20216%20Soil%20Testing%20FAQ%20RPP-%2004-10-2026.pdf
Midwest Cover Crops Council (2026, March). Labs that conduct soil health testing for CEMA 216 (comparison sheet). Third-party compilation of lab quotes.https://midwestcovercrops.b-cdn.net/wp-content/uploads/2026/04/April-24-CEMA-216-spreadsheet.pdf
Ward Laboratories, Inc. (2026). CEMA 216 - Soil Health Testing (flyer, March 2026).https://www.wardlab.com/wp-content/uploads/2026/03/CEMA-216-Flyer-Finalv1.pdf
Ward Laboratories, Inc. (2026). Pricing, fee schedule effective January 1, 2026. Captured September 17, 2026.https://www.wardlab.com/pricing/
Regen Ag Lab, LLC (2025). Soil Health Analysis, pricing effective January 1, 2025. Captured September 17, 2026.https://regenaglab.com/services/soil-health-analysis/
Midwest Laboratories. Soil Season (package pricing and turnaround). Undated; captured September 17, 2026.https://midwestlabs.com/soil-season
Cornell Soil Health Laboratory. Individual Soil Analyses. Undated; captured September 17, 2026.https://soilhealthlab.cals.cornell.edu/testing-services/individual-soil-analyses/
Cornell Soil Health Laboratory. Soil Health Analysis Packages. Undated; captured September 17, 2026.https://soilhealthlab.cals.cornell.edu/testing-services/soil-health-analysis-packages/
Cornell Soil Health Laboratory. FAQ (turnaround and sample volume).https://soilhealthlab.cals.cornell.edu/testing-services/faq/
University of Vermont Soil Health Research and Extension Center (2026, April). CEMA 216 Soil Health Testing, fact sheet SHREC FS 11.https://www.uvm.edu/d10-files/documents/2026-04/SHREC_FS_11_CEMA216.pdf
Cornell Soil Health Laboratory (2017). CASH Soil Health Series fact sheet 4: Soil Texture.https://bpb-us-e1.wpmucdn.com/blogs.cornell.edu/dist/7/9922/files/2021/11/04_CASH_SH_Series_Texture.pdf
Ozlu, E., Heitman, J., Osmond, D. (2024, January 31). Soil Health: What Does It Mean in North Carolina? NC State Extension.https://content.ces.ncsu.edu/soil-health-what-does-it-mean-in-north-carolina
Krupek, F.S., Mizero, S.M., Redfearn, D., Basche, A. (2022, September 28). Assessing Soil Health at the Field Scale: Putting Reference Soils and Sampling Strategies All Together. UNL CropWatch.https://cropwatch.unl.edu/2022/assessing-soil-health-field-scale-putting-reference-soils-and-sampling-strategies-all-together/
USDA Natural Resources Conservation Service. (2026). CEMA 216—Soil Health Testing Job Aid, 4-2026. Checked September 17, 2026.https://www.nrcs.usda.gov/sites/default/files/2026-05/CEMA%20216%20Job%20Aid_4-2026.pdf