A report that says only 'AMF: high' is incomplete. High in what—stained root length, spores per gram, DNA copies, sequence reads, lipid concentration, or infective propagules? Was the sample root or soil? At what crop stage? Against what reference? The method and unit define the meaning of the number.
That distinction matters because AMF live in several compartments at once. Inside roots they form hyphae, arbuscules, and sometimes vesicles. Outside roots they form a soil mycelium and spores. Spores, living hyphae, and colonized root fragments can all be inoculum. A method that sees one compartment can miss another. USDA-NRCS describes soil biological values as generally understood directionally—higher is better—while noting they may not be well defined regionally and that PLFA interpretation in particular remains challenging [1]. It sets no calibrated critical limits for mycorrhizal measurements.
First choose the biological question
| Question | What to sample | Useful first method | What the result does not prove |
|---|---|---|---|
| Are these roots colonized? | Fine roots from a known plant | Clear, stain, and score intersections by microscopy | That colonization improved nutrition or yield |
| How many spores are recoverable? | Rhizosphere or bulk soil | Wet sieving, density separation, and microscopic count | That every spore is viable or that spores are the only inoculum |
| How much infective inoculum is present? | Soil plus small colonized-root fragments | Host-plant bioassay or most-probable-number dilution assay | Field performance under a different host or soil |
| How extensive is the soil mycelium? | Soil or a root-excluding mesh compartment | Hyphal extraction and length measurement | That every observed hypha is AMF, alive, or transferring nutrients |
| How much AMF-associated biomass is present? | Soil or roots | NLFA 16:1ω5, with appropriate controls |
Before the laboratory: design the sample
Sampling error can be larger than analytical precision. AMF are patchy at small spatial scales, and sampling effort changes the apparent richness and composition of a community. In one local study, 25 grid samples per plot still revealed strong spatial heterogeneity; the point is not that every field needs 25 samples, but that one root or one soil core is rarely a defensible field average [16].
- Define the comparison. Examples: treated versus untreated strip, this field versus a reference field, or change through the season. A single result without a comparator is difficult to interpret.
- Name the host and compartment. Collect identifiable fine roots if measuring colonization. Collect rhizosphere or defined bulk soil if measuring spores, propagules, lipids, hyphae, or DNA. Do not silently mix roots of several plant species.
- Standardize location and depth. Use the same root-zone position, soil depth, crop growth stage, and sampling pattern across treatments and dates.
- Replicate independent field units. Several cores combined within one strip make a composite sample; they do not replace multiple strips, plots, or fields when statistical inference is needed.
- Record context. Crop and cultivar, growth stage, recent crop, soil moisture, temperature or weather, tillage, fertilizer and pesticide history, and soil-test phosphorus can all matter.
- Ask the laboratory before sampling. Microscopy, culture, lipid, DNA, and RNA methods require different containers, temperatures, preservatives, and holding times. Split and preserve material immediately when several analyses are planned.
- Keep the design the same through time. Directional change measured consistently is usually more defensible than comparing values produced by different protocols or laboratories [1][16].
Level 1: look inside the root
Root clearing, staining, and microscopy
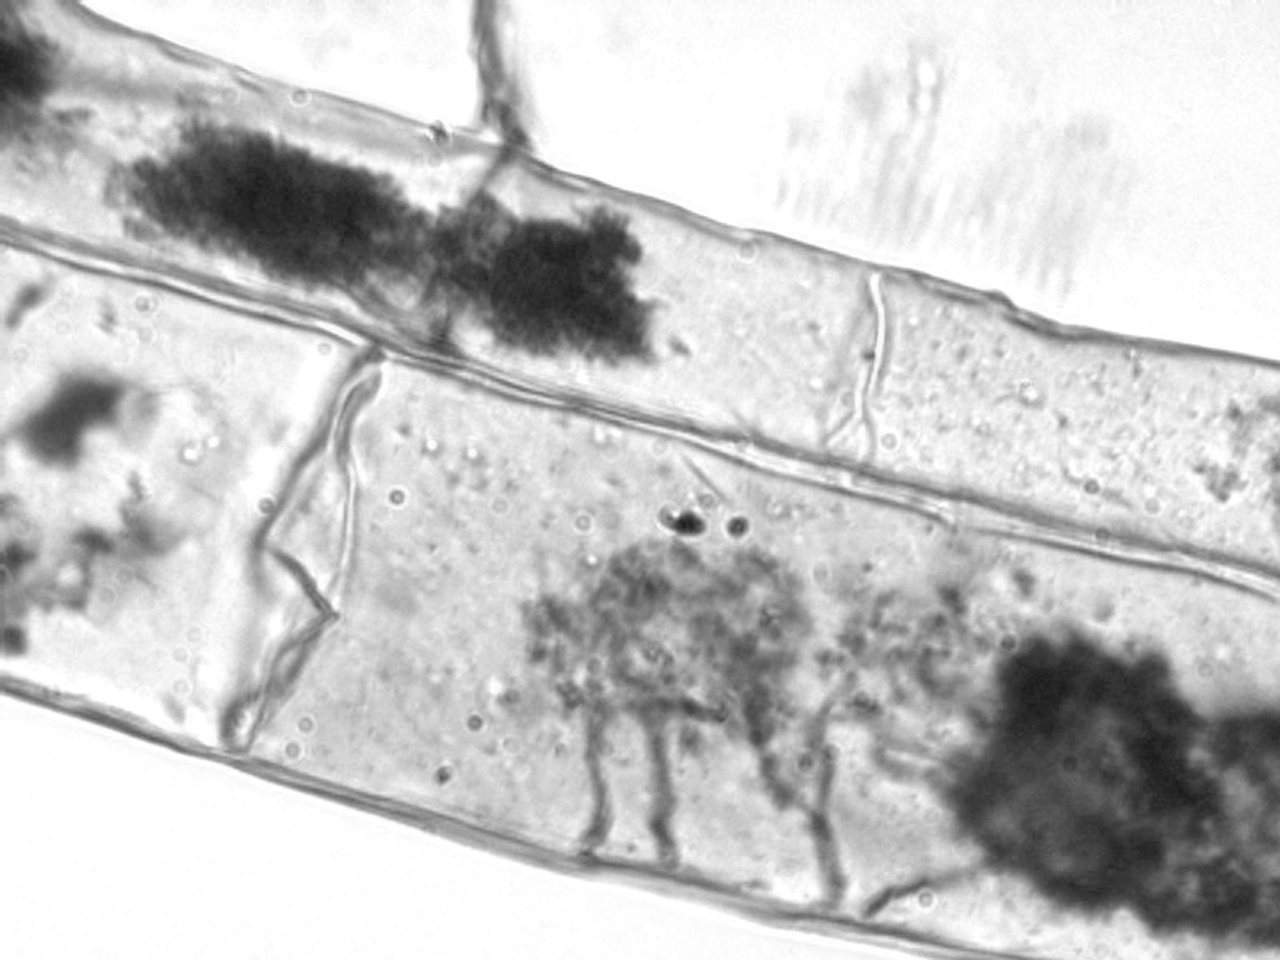
The most accessible direct measure is percentage of root length colonized. Fine roots are washed, chemically cleared so internal structures can be seen, stained, mounted, and observed under a microscope. Phillips and Hayman's classic procedure used trypan blue [4]. An ink-and-vinegar method was later developed as a reliable, inexpensive alternative after adequate clearing, avoiding several hazardous dyes used in older protocols [3]. Chemical handling still requires a laboratory risk assessment and suitable protective equipment.
For objective scoring, the magnified-intersections method examines predetermined root–crosshair intersections, commonly around 200×. Each intersection is recorded for arbuscules, vesicles, and hyphae rather than assigning a vague visual rating. This yields separate estimates of arbuscular, vesicular, and hyphal colonization [2].
What root structures tell you
| Microscopic result | Reasonable interpretation | Important limitation |
|---|---|---|
| Total colonized root length | Extent of sampled root containing recognizable AMF structures | Does not measure external soil mycelium or crop benefit |
| Arbuscular colonization | Fraction of root length with the principal exchange structures | A time-sensitive structural snapshot, not a direct nutrient-flux measurement |
| Vesicular colonization | Storage structures formed by many AMF | Not all AMF form vesicles, and look-alikes can occur |
| Hyphal colonization | Fungal threads within the root | Morphology alone can be ambiguous |
Microscopy is inexpensive relative to molecular work and shows the actual structures in roots, but it is labor-intensive, observer-dependent, and sensitive to root thickness, clearing, staining, subsampling, and scoring rules. Automated image analysis can help: AMFinder uses supervised deep learning to identify colonized root regions and internal structures, and produced results comparable to standard counting in its validation datasets. It still requires standardized images and human review; an algorithm does not repair poor staining or biased root sampling [15].
Level 2: count spores or test infectivity
Spore extraction and counting
AMF spores can be separated from soil by wet sieving and decanting, often followed by density separation, collection on a filter, and examination under a dissecting microscope. The foundational wet-sieving method was published by Gerdemann and Nicolson in 1963 [5]. Counts are normally reported per dry mass or volume of soil, with sieve sizes and extraction details stated.
- Strength: comparatively low-cost measurement that also allows expert morphological description of recoverable spores.
- Blind spot: spores are only one propagule type; living hyphae and colonized root fragments are missed.
- Viability problem: an intact-looking spore is not automatically viable or infective.
- Timing problem: sporulation varies among taxa, hosts, seasons, and environments, so spore counts need not track current root colonization.
- Taxonomy problem: morphology requires specialist training, and damaged, immature, or cryptic spores can be difficult to identify.
Trap cultures, host bioassays, and most-probable-number assays
If the question is 'can this material colonize a host?', grow a compatible test plant in controlled substrate containing the soil or product. After several weeks, stain the roots and score colonization. A trap culture can also encourage fungi that were not sporulating at field sampling to multiply and produce identifiable spores. A positive result demonstrates infectivity under the assay conditions, not guaranteed performance in another soil or crop.
The most-probable-number (MPN) method uses replicated serial dilutions of inoculum. Each pot is scored positive or negative for colonization, and a statistical table or model estimates infective propagules per unit of sample. Porter's original comparison found that an MPN assay detected a large population of fine infective propagules that wet sieving could not enumerate [6]. MPN captures infectivity from several propagule types, but it takes weeks and its estimate changes with host, diluent soil, temperature, assay duration, and other growth conditions [7].
A viability bioassay can overturn a product label
| Measure | Value |
|---|---|
| Commercial: no colonization | 84 % |
| Commercial: biomass increase (sterilized soil) | 20 % |
| Lab culture: colonization, Australia | 48 % |
| Lab culture: colonization, Europe | 79 % |
That result explains why a product's listed spore count, a DNA detection, and a host bioassay answer different questions. A later synthesis covering 302 trials of commercial inoculants likewise found commercial products colonized roots much less than laboratory-grown inoculum [19]. For product quality, include an uninoculated negative control, a validated viable positive control, and a plant-growth endpoint—not only a label claim.
Level 3: measure the fungal network or a biomass proxy
Extraradical hyphal length
Fungal hyphae can be extracted from soil into suspension, captured on a membrane filter, stained, and measured by grid intersections or image tracing. Results are often expressed as hyphal length per mass or volume of soil. The method can quantify the network outside roots—the part root microscopy misses—and image-processing approaches can improve precision and reduce observer bias, though they take about as long as manual grid counting [8].
The hard part is identity and condition. Soil contains non-AM fungi; classification by diameter, branching, septation, and staining is imperfect. Stained length can include dead hyphae. Activity stains and root-excluding mesh compartments can strengthen inference, but they introduce their own assumptions. Hyphal length is therefore best described as an operational measurement produced by a stated protocol, not a perfect census of living AMF.
Lipid biomarkers: NLFA and PLFA 16:1ω5
The fatty acid 16:1ω5 is widely used as an AMF-associated biomarker. Its neutral-lipid fraction (NLFA) is strongly associated with AMF storage lipids and is often the more sensitive biomass proxy. The phospholipid fraction (PLFA) reflects membrane lipids but can include bacterial background. Olsson and Lekberg warn that using PLFA 16:1ω5 without appropriate non-mycorrhizal controls can produce erroneous conclusions and recommend NLFA when estimating AMF biomass [9].
In a field comparison, propagule number and NLFA 16:1cis11 were more consistently responsive to cover-crop treatment than the same marker in the PLFA fraction, while none formed a simple, strong predictor of crop performance [11]. Units, extraction fraction, conversion assumptions, sample moisture basis, and controls must be reported. A generic PLFA report or fungal:bacterial ratio is not an AMF census.
Level 4: measure AMF DNA
Conventional PCR, qPCR, and digital PCR
What the main PCR methods add
| Method | Best use | Typical output | Main caveat |
|---|---|---|---|
| Endpoint PCR | Target present or not detected | Band or sequence from an amplified target | Weakly quantitative; a negative can reflect inhibition or primer mismatch |
| qPCR | Compare a selected AMF group or strain among samples | Cycle threshold converted to relative signal or target copies using standards | Copies are not automatically cells, biomass, viability, or activity |
| Droplet digital PCR | Low-abundance or strain-specific target with absolute partition counting | Target copies per reaction or sample unit | Still depends on validated specificity and represents DNA copies |
Broad AMF qPCR can process many root samples more consistently than manual scoring. One validated relative-qPCR method normalized an AMF 18S rRNA target to a plant gene and separated low from high colonization in Petunia roots [12]. But it could not distinguish arbuscules, vesicles, and hyphae, and the authors emphasized validation for other plant species and sample types.
Ribosomal DNA is not a single-copy ruler. Copy number and intragenomic variation can differ, AMF are multinucleate, extraction efficiency varies, and soil compounds can inhibit PCR. A DNA signal may also persist after loss of infectivity. State the gene, primers or probe, standard, extraction recovery, inhibition test, detection and quantification limits, and whether the result is relative or absolute.
For an introduced inoculant, a validated strain-specific qPCR or droplet-digital-PCR assay is much stronger than a broad AMF assay. Thomsen et al. used a strain-targeted ddPCR assay to follow a commercial Rhizophagus inoculant in vineyard roots and soil; it was not detected as successfully established over the five-year study [20]. Detection would have shown that the target DNA was present—not that the strain caused plant benefit—so microscopy and plant responses remain separate endpoints.
Amplicon metabarcoding
Amplicon sequencing uses primers to copy a taxonomic marker—commonly part of the small-subunit or large-subunit ribosomal region—from a mixed sample, sequences the products, and compares them with a reference database. It can describe the AMF community detected in roots or soil far beyond what routine spore morphology can resolve. MaarjAM is a curated AMF sequence and metadata resource widely used for reference assignments [13][14].
- Primer coverage: no primer pair amplifies every AMF taxon equally; off-target amplification and missed taxa are possible.
- Marker resolution: some sequences resolve broad lineages better than species or strains.
- Database coverage: an unknown or poorly represented lineage may be assigned only at a high taxonomic level.
- Relative abundance: read percentage is compositional and distorted by amplification and gene-copy differences; it is not percent biomass.
- Compartment: root and soil communities can differ, so the sample must match the question.
- Pipeline dependence: filtering, chimera removal, taxon definitions, and reference version affect the result [13][14].
Shotgun metagenomics avoids a single targeted amplicon and can recover a broader set of genes, but AMF DNA may be a small fraction of root or soil DNA and host contamination can dominate. It describes genetic potential, not expression. RNA sequencing or metatranscriptomics can provide a closer snapshot of expressed genes, but RNA changes rapidly and demands stringent preservation, deeper sequencing, and careful separation of plant, AMF, and other microbial transcripts. These are research tools, not universal field soil-health scores.
Level 5: test what the fungus is doing
The strongest evidence of function does not come from abundance alone. It comes from an experiment that separates the mycorrhizal pathway from direct root uptake and other explanations. A common design places labeled nutrient in a soil compartment behind a fine mesh: fungal hyphae can enter, but roots cannot. Rotating or severing the hyphae in a matched control strengthens the causal comparison.
Advanced methods for AMF function and mechanism
| Method | Question answered | What makes it powerful | Why it is not a routine soil test |
|---|---|---|---|
| Mesh compartment + ^33P or ^32P | Did hyphae acquire and transfer phosphorus? | Root exclusion plus a traceable phosphorus pool | Radioisotope licensing, containment, experimental assumptions |
| ^15N tracer | Did nitrogen move through a hypha-accessible pathway? | Stable-isotope enrichment can be quantified in plant tissue | Transfer pathway and background pools require controls and modeling |
| ^13CO2 pulse–chase | How much recent plant carbon enters roots, AMF, soil, or respiration? | Tracks newly fixed carbon through time | Separating AMF from other rhizosphere carbon flows is difficult |
| Confocal or live-cell microscopy | Where and when do fungal structures develop? | Optical sections, fluorescent labels, and three-dimensional localization | Small field of view, specialized preparation, mostly mechanistic |
| Electron microscopy / NanoSIMS / elemental imaging |
A trans-European study illustrates the difference between abundance and function. Researchers used soil from 150 cereal fields and 60 grasslands in a greenhouse mesh-compartment assay with ^33P. AMF communities from grassland soils transferred 64% more tracer phosphorus to plants than those from cropland soils, and fungicide use plus lower AMF richness was associated with a 43% reduction in tracer uptake in cropland soils [17]. Those are controlled functional results; they are not universal calibration values for an individual field.
Which method should you choose?
A practical decision matrix
| Decision | Minimum defensible measurement | Stronger confirmation | Management endpoint |
|---|---|---|---|
| Did a practice change root colonization? | Standardized root microscopy in replicated treated and control plots | Relative AMF qPCR on the same roots | Plant P uptake plus yield or biomass |
| Does soil contain viable native inoculum? | Host bioassay | MPN dilution assay plus spore and root observations | Colonization speed under the target crop |
| Did a purchased product contain viable propagules? | Sterile-substrate host bioassay with negative and viable positive controls | Label-target DNA and contaminant screening | Root colonization and plant response |
| Did the purchased strain establish in field soil? | Validated strain-specific qPCR or ddPCR over time | Sequencing plus root microscopy | Yield, quality, nutrient uptake, and economics |
| Did management change the AMF community? | Replicated AMF metabarcoding with fixed sampling and pipeline |
Three realistic testing tiers
- Tier 1—farm monitoring: replicated treated and comparison strips; standardized fine-root microscopy; routine soil fertility; plant tissue nutrients; yield or quality. Repeat at the same growth stage.
- Tier 2—diagnostic or applied research: Tier 1 plus a host bioassay or MPN, NLFA 16:1ω5, broad qPCR, and/or AMF metabarcoding. Select only the additions that answer a defined uncertainty.
- Tier 3—mechanism or strain validation: strain-specific ddPCR, controlled mesh compartments, isotope tracing, time-resolved sampling, transcriptomics, and advanced imaging. This tier supports causal or mechanistic claims, not routine ranking of fields.
Questions to ask a commercial laboratory
- What exactly is measured, in which compartment, and in what units?
- Is the method microscopy, culture, lipid analysis, qPCR, digital PCR, or sequencing? Ask for the protocol name or a technical reference.
- How should roots or soil be collected, stored, shipped, and held before analysis?
- What are the method's detection limit, quantification limit, repeatability, and known interferences?
- For microscopy: how are roots subsampled, how many intersections are scored, at what magnification, and are arbuscules, vesicles, and hyphae reported separately?
- For qPCR or ddPCR: what gene, primers, and probe are used; what taxa or strain do they include or exclude; and how are inhibition and extraction recovery checked?
- For sequencing: what marker, primer pair, positive and negative controls, reference database and version, filtering pipeline, and taxonomic unit are used?
- Is the output absolute or relative? If the report uses words such as low, normal, or high, what independent calibration supports those categories?
- Are there field benchmarks for this crop, stage, soil, region, and sampling method—or only the laboratory's internal distribution?
- Will the laboratory report uncertainty, raw units, batch information, and enough metadata to repeat the test later?
Frequently asked questions
Can I see AMF with a phone or hand lens?
Not reliably inside ordinary field roots. Diagnostic arbuscules and fine internal hyphae usually require cleared, stained roots and a microscope. Large spores may be visible under a dissecting microscope after extraction, but a spore image does not measure root colonization or viability.
Is spore count the same as colonization?
No. Spore count measures recoverable spores in the sampled soil. Colonization measures AMF structures in sampled roots. Sporulation, germination, root entry, and intraradical growth are separate stages.
Does a DNA test show that AMF are alive?
Usually not by itself. DNA detection supports presence of a target sequence. Viability requires a culture or host-infectivity assay, or a carefully validated molecular viability approach. RNA can indicate recent expression, but preservation and interpretation are substantially harder.
Does PLFA or a fungal:bacterial ratio measure AMF?
Not specifically. PLFA 16:1ω5 can include bacterial background, and a total fungal:bacterial ratio pools many organisms. If lipid analysis is used for AMF, ask for the neutral-lipid fraction NLFA 16:1ω5, its units, controls, and interpretation [9][11].
What is the best single AMF test?
For root colonization, stained-root microscopy is the clearest first test. For viable inoculum, use a host bioassay or MPN. For community composition, use AMF-targeted sequencing. For introduced-strain establishment, use a validated strain-specific assay. For nutrient transfer, use a controlled tracer experiment. There is no best single test for an undefined concept such as 'AMF health.'
When should I sample?
Sample at the stage relevant to the question and keep it consistent. Early sampling can examine colonization establishment; later sampling may capture a mature symbiosis or sporulation. Comparing a seedling sample with a flowering-stage reference confounds time with treatment. If seasonal dynamics matter, prespecify several dates rather than searching afterward for the most favorable result.
How to interpret any AMF result
- Read the noun and unit. Colonized root length, spores, infective propagules, hyphal length, lipid concentration, target copies, and sequence reads are different nouns.
- Check the denominator. Per gram dry soil, per gram fresh root, per unit DNA, or relative to plant DNA changes the meaning.
- Check the comparator. A calibrated control or matched field treatment is stronger than a database percentile built from unknown crops and protocols.
- Separate detection, abundance, activity, and benefit. Evidence for one is not automatically evidence for the next.
- Look for agreement across independent endpoints. Root structures plus strain-specific DNA plus plant phosphorus uptake tell a stronger story than three variants of the same DNA assay.
- Avoid universal thresholds. Current soil-health guidance does not provide broadly validated AMF sufficiency cutoffs for routine conservation planning [1].
- Connect biology to the decision. A change matters agronomically when it improves a prespecified plant, soil, environmental, or economic outcome.