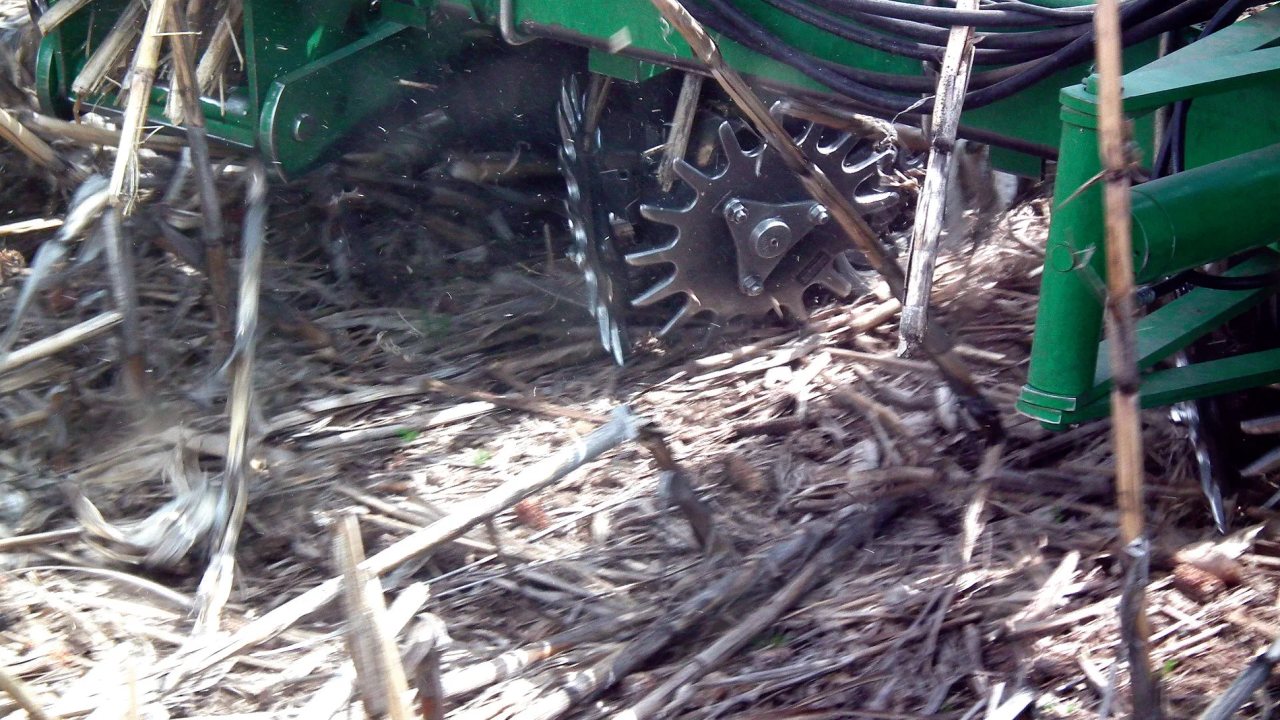
The saving from no-till starts on the day a tractor stays in the shed. In the Iowa corn budget below, taking two paid tillage passes out of the schedule saves $20 an acre, which covers about 4.4 bushels of lost yield at a net corn price of $4.50/bu. A farm already down to one cultivator pass starts the same switch $0.75 an acre behind, so the first question is which jobs actually disappear on your acres.
Start with the passes you can remove
This example compares custom-hired operations on the same Iowa corn acres. The original system chisels, field cultivates and plants, while the no-till system plants with a no-till planter and adds a separate spray pass, because a burndown now does the early weed control that tillage used to do. Iowa State's 2026 survey averages supply the operation charges, and the herbicide materials and grain price are planning assumptions. Iowa State 2026 Custom Rate Survey, pp. 2–3
Two schedules for the same corn field
| Changed cost | Chisel system | No-till system |
|---|---|---|
| Chisel plowing | $20.75/ac | — |
| Field cultivating | $19.20/ac | — |
| Planting | $26.50/ac | $29.10/ac |
| Extra self-propelled spray pass | — | $9.35/ac |
| Extra herbicide materials | — | $8.00/ac |
| Total changed costs | $66.45/ac | $46.45/ac |
Dropping only the $19.20 cultivator pass gives a different answer, because the $2.60 planting premium and $17.35 for added spraying and herbicide leave the switch $0.75 behind. An existing burndown changes that arithmetic. When both systems already make the same trip, the $9.35 custom spray charge comes out of the added-cost column, and with the $8 herbicide premium still in place the one-pass example saves $8.60/ac at flat yield.
A higher corn price makes each lost bushel cost more
Price the yield line with the corn price left after the harvest, drying and hauling costs that rise with each extra bushel. In the two-pass example the margin change is $20 plus the yield change times that net price, so a 4-bushel loss leaves $2/ac at $4.50 corn but costs $2/ac at $5.50. The same planter and pass schedule can clear break-even at one price and miss it at another.
No-till margin by yield change and net corn price
| Yield change | $3.50/bu | $4.50/bu | $5.50/bu |
|---|---|---|---|
| −8 bu/ac | −$8 | −$16 | −$24 |
| −6 bu/ac | −$1 | −$7 | −$13 |
| −4 bu/ac | +$6 | +$2 | −$2 |
| −2 bu/ac | +$13 | +$11 | +$9 |
| Flat yield | +$20 | +$20 | +$20 |
| +2 bu/ac | +$27 | +$29 | +$31 |
Each value is the change in dollars per acre against the same chisel system with two passes removed. Dividing the $20 saving by the three net corn prices gives tolerable yield losses of 5.7, 4.4 and 3.6 bu/ac, and that cushion is what the rest of this article tests.
Where no-till yields hold and where they slip
Whether a field stays inside the cushion depends heavily on climate, drainage and rotation. Pittelkow and colleagues pooled 5,463 paired yield observations from 610 studies and found that no-till on its own lowered yields, but that the loss shrank when crop residue stayed on the field and crops were rotated. In dry climates, where annual precipitation is less than about two-thirds of potential evapotranspiration, rainfed no-till with both practices out-yielded conventional tillage, whereas in humid climates it trailed tillage with or without them. Pittelkow et al. 2015, Nature
A review of North American corn trials points the same way. DeFelice and colleagues summarized 61 corn experiments in the United States and Canada and found no-till yields about even with conventional tillage overall, but lower in the northern states and Canada, on poorly drained soils and in continuous corn. They traced the northern drag to cold, wet springs and poorly drained soils that slow emergence and early growth where the season is short. DeFelice et al. 2006, Crop Management
No-till corn yield against conventional tillage
| Situation | No-till yield difference | On a 200 bu/ac field |
|---|---|---|
| Southern and western regions | +12.2% (26) | +24.4 bu/ac |
| Moderately to well-drained soils | +2.0% (64) | +4.0 bu/ac |
| Corn–soybean rotation | +1.9% (38) | +3.8 bu/ac |
| All experiments | −0.5% (104) | −1.0 bu/ac |
| Continuous corn | −1.5% (60) | −3.0 bu/ac |
| Transition region | −1.8% (16) | −3.6 bu/ac |
| Poorly drained soils | −4.5% (40) | −9.0 bu/ac |
| Northern U.S. and Canada | −5.5% (62) | −11.0 bu/ac |
Set against the 4.4-bushel cushion at $4.50 corn, the northern and poorly drained averages would more than erase the two-pass saving on a 200-bushel field, and the transition-region average would use most of it. The averages for rotated corn and well-drained soils, by contrast, keep the saving and add to it. Because these are averages across many trials, they tell you which of your fields deserves a strip comparison first.
How the yield gap changes with time
Time changes the answer as well. In the same global review, no-till with residue retention and rotation gave up the most yield in its first two years, and ten or more years after adoption its gap with conventional tillage was no longer statistically distinguishable from zero. Without residue or rotation the pattern ran the other way, with a larger loss at ten or more years than in the first two, although few long studies fall in that group. Where residue stays and crops are rotated, a transition budget should therefore carry a larger yield-loss allowance for the first seasons and shrink it as your own strips show the gap closing. Pittelkow et al. 2015, Figure 3
Long trials show where the dollars came from
Three long-running trials show what decades of no-till returned. Zhang and colleagues took about thirty years of data from each site, priced the field operations, seed, fertilizer and pesticides, and valued the yield difference at 2024 harvest prices. The Ohio records start about twenty years after those plots were established, while the Michigan record starts with the switch in 1989. The two Ohio sites rotated corn and soybeans and the Michigan site added wheat, so the chart shows only its corn and soybean years.
No-till net returns in three long-term trials
| Measure | Value |
|---|---|
| Hoytville, OH · corn | 34.04 $/ac |
| Hoytville, OH · soy | 30.03 $/ac |
| Wooster, OH · corn | 73.73 $/ac |
| Wooster, OH · soy | 58.97 $/ac |
| Michigan · corn | 92.5 $/ac |
| Michigan · soy | 85.72 $/ac |
Among the costs, field operations moved the most. At Hoytville, Ohio, the corn budget saved $23.59/ac on operations and added $2.38/ac in pesticide expense, while the estimated yield difference contributed $12.84/ac, so even with yield held flat the cost changes alone left $21.21/ac. At the Michigan site the corn yield estimate was 15.6 bu/ac higher, worth $66.15/ac on top of $34.89/ac in operation savings, although pesticide costs rose $9.86/ac. Zhang et al., Tables 3 and 4
The baseline matters as much as the years. Against moldboard plowing instead of chisel tillage, the same paper estimated larger corn gains at the two Ohio sites, about $81/ac at Hoytville and $133/ac at Wooster. When the authors split the records by decade, the operation savings were statistically significant in every decade at every site and generally grew, whereas Michigan's corn yield gain became significant only in the most recent decade. The cost line is therefore the part of a first-year budget you can count on, and the yield line is the part to test in your own strips. Zhang et al., Tables 1 and 9 and Figure 5
Flanders and colleagues at the Soil Health Institute came at the question from the farm side, interviewing 100 farmers already using reduced tillage, some of them with cover crops. Against the operations those farmers described before adoption, their budgets estimated that net income rose an average of $53/ac for corn and $45/ac for soybeans, converted from $132 and $111 per hectare. Expense savings accounted for roughly $24/ac in corn and $17/ac in soybeans, and crop sales explained the rest. Because these retrospective budgets capture a mix of changes on established farms, anyone adding cover crops at the same time should track cover seed, termination and forage separately to see which line moved. Flanders et al. 2026, Soil Health Institute
Weed control moves from the tillage tool to the sprayer
Taking out tillage hands its weed control to the sprayer. University of Wisconsin–Madison Extension specialists advise starting clean with pre-plant cultivation or an effective burndown, then staying clean with a soil residual program without cutting rates. They also note that marestail has become a growing problem as more growers switch to no-till. Mixing effective herbicide sites of action delays resistance, and preventing resistant weeds from establishing is often cheaper than controlling them afterward. UW–Madison Extension, 2020
Resistance management is therefore a standing cost line. SARE's cover crop economics bulletin notes that herbicide-resistant weeds normally drive up herbicide costs because more expensive residual products come into the program, and pesticide costs rose in both the Hoytville and Michigan corn budgets above. In the Iowa example, every $4.50/ac added to the herbicide bill uses up one bushel of the 4.4-bushel cushion at $4.50 corn, so the budget should price the residual and the second site of action you expect to need along with the burndown. SARE, Cover Crop Economics, p. 9
Strip-till sits between the two schedules
On cold, poorly drained ground, strip-till offers a middle path. A fall pass tills strips about 6 to 8 inches wide that dry and warm faster in spring, while about three-quarters of the residue stays on the surface. Iowa State recommends it for relatively flat, poorly drained land where soils run cold and reports a yield advantage over no-till in those wet soils. It is a poorer fit on steep or highly erodible ground, where the tilled row itself can erode. Iowa State Extension, strip-tillage concept and management
Strip-till against the two schedules
| Changed cost | Chisel system | Strip-till | No-till |
|---|---|---|---|
| Chisel plowing | $20.75/ac | — | — |
| Field cultivating | $19.20/ac | — | — |
| Strip-till pass, no fertilizer | — | $23.20/ac | — |
| Planting | $26.50/ac | $26.50/ac | $29.10/ac |
| Added spray pass and herbicide | — | $17.35/ac | $17.35/ac |
| Total changed costs | $66.45/ac | $67.05/ac | $46.45/ac |
In this example, strip-till costs about the same as the chisel system and $20.60/ac more than no-till, so on a field where no-till slips it has to protect about 4.6 bu/ac of corn over no-till at $4.50 to earn its place. The rig can also place fertilizer in the same pass, which changes the comparison on farms that already pay for a separate application. Iowa's survey puts strip-till with anhydrous at $28.35/ac before materials, against $15.55/ac for a separate toolbar application, so folding the two jobs together narrows the gap with no-till to about $10.20/ac, or roughly 2.3 bushels. Iowa State 2026 Custom Rate Survey, pp. 2–3
The cash saving depends on who owns the iron
A custom invoice can disappear this season, but with owned equipment the cash you free up is the fuel, wear and paid hours you avoid. The ownership bill stays in the comparison until a sale or a different replacement plan changes it. Because the Iowa custom rates bundle operator labor, depreciation, interest and other machinery costs, they overstate the cash an owner saves by leaving a tractor parked. Iowa State custom rates, p. 1
Suppose your owned-equipment budget shows $20/ac in operating savings before a planter retrofit, and the retrofit adds $5,000 a year in equivalent ownership cost once its useful life, the cost of capital and resale value are counted. At flat yield, the retrofit needs 250 acres a year to cover that bill. Spread over 400 acres, it takes $12.50/ac of the saving and leaves $7.50/ac, enough for about 1.7 bu/ac of yield loss at $4.50 corn. On 200 acres it costs $25/ac, so the change has to find another $5/ac from yield or from a purchase you can drop. That is why the investment should be sized on the acres you expect to plant over its useful life. UW–Madison Extension on cash and economic budgets
What the tillage budget leaves out
The operation budget counts the passes you drop and the grain you sell, but a watershed asks a different question: how much soil and nutrient leaves the field? Over 16 crop years, USDA researchers compared no-till and chisel tillage on four small watersheds in the same corn–soybean rotation with a rye cover. Annual soil loss in surface runoff averaged about 0.36 short tons/ac under no-till and 0.48 under chisel tillage, while dissolved phosphorus moved the other way, at about 0.29 lb P/ac per year under no-till and 0.19 under chisel. A downstream buyer would therefore need sediment and dissolved phosphorus on separate lines. Shipitalo et al., USDA Agricultural Research Service
To price a sediment outcome, estimate how much of the reduction reaches the waterbody where it changes a cost. If a reservoir operator could avoid removing a tenth of a ton per enrolled acre each year and spends $40 for each additional ton it removes, the illustrative avoided cost is $4/ac per year. An agreement would then set the delivery estimate, the monitoring cost and the share that reaches the grower. A food buyer sourcing corn from the same field might instead pay for acres planted without tillage. An as-planted record can document that practice, while the reservoir operator needs evidence of sediment delivered to the reservoir.
Put the first comparison on a field where you can harvest adjacent strips with the same hybrid and measurement method, and record the planting dates, every pass and each load of grain. At the end of the season you will know what came out of the schedule and how many bushels that saving bought, and each season after that will show whether your yield gap is closing the way the long trials suggest.
Funding the first no-till acres
For a switch from chisel plowing to no-till, ask the local NRCS office about EQIP assistance for Residue and Tillage Management, No Till (329). A practice payment can offset transition costs even when you custom-hire the planting. The Soil and Water Outcomes Fund is another option in eligible areas for a new or expanded conservation practice. Ask for a field-specific offer before committing acres or ordering equipment.
Under IRS Publication 225, part of a USDA-certified cost-share payment for a capital improvement can be excluded from income under section 126 of the tax code, and EQIP is among the listed programs, but a payment for changing management, such as adopting no-till itself, is not a capital improvement and is reported as income. Ask your tax preparer how each payment will be treated before you count it in the budget. Local soil-health funding can change what a grower has to finance in the first season.
The tractor pass a grower skips shows up in the fuel bill that week. Sediment kept out of a reservoir may only show up years later in a dredging schedule. An agreement linking the two has to cover the cost of tracing the sediment and still leave enough with the grower to help keep that soil in place.