“No measurable economic return.”
That phrase opened a recent discussion from Joe Ailts at Ailts Agronomy about farmers’ reasons for not planting cover crops. Joe asked the question underneath many soil-health debates: if cover crops retain topsoil and nutrients, contribute carbon, alter water movement, and affect soil biology, what equation translates those changes into economic value?
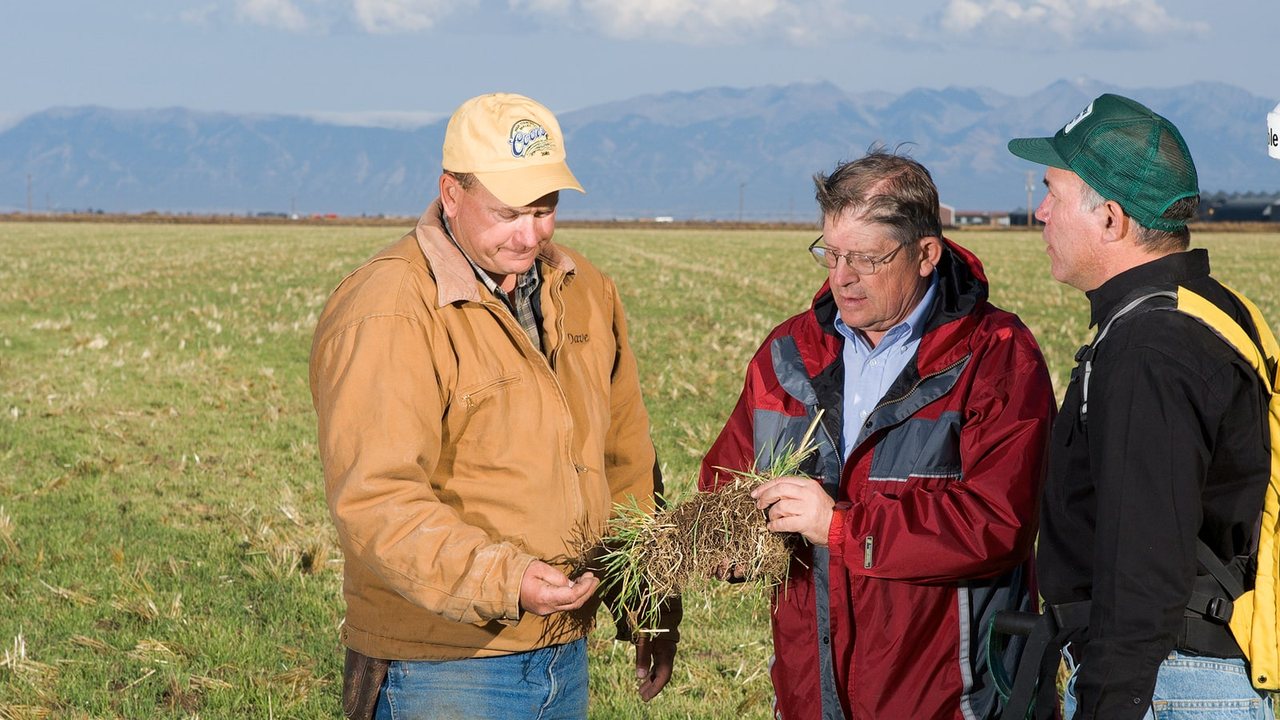
The comments contained the beginnings of an answer. Brian Dougherty estimated the replacement value of soil and nitrogen retained. Todd Steinacher raised weed-control costs. Jeff Hyatt described keeping land productive for his children. Kent Nonemacher described a field where moisture created a challenge even though covers fit elsewhere in his operation.
Those farmers were not disagreeing about one number. They were describing different ledgers and different time horizons.
A farmer asking whether covers pay may mean next spring’s cash flow. A landowner may mean what the field can produce in twenty years. A water utility may care about nitrogen that never reaches the intake. A lender or insurer may care about whether a field can withstand drought, flooding, or input-price volatility.
The problem is not that healthy soil has no economic value. The problem is that most accounting systems stop at one farm budget and one season. TerraValue is being built to extend that ledger.
The question is not whether soil has value
A management change creates a chain: the practice changes a physical process; that process changes a cost, yield, risk, or environmental condition; and that consequence creates value for someone. The farmer, landowner, buyer, lender, insurer, utility, watershed, and public may each receive a different part of it.
TerraValue’s job is to keep that chain connected. What changed? Compared with what? When does the benefit arrive? Who receives it? What would have happened without the practice? Which part appears in the farm’s cash flow, and which part needs a contract or market before it can return to the farm?
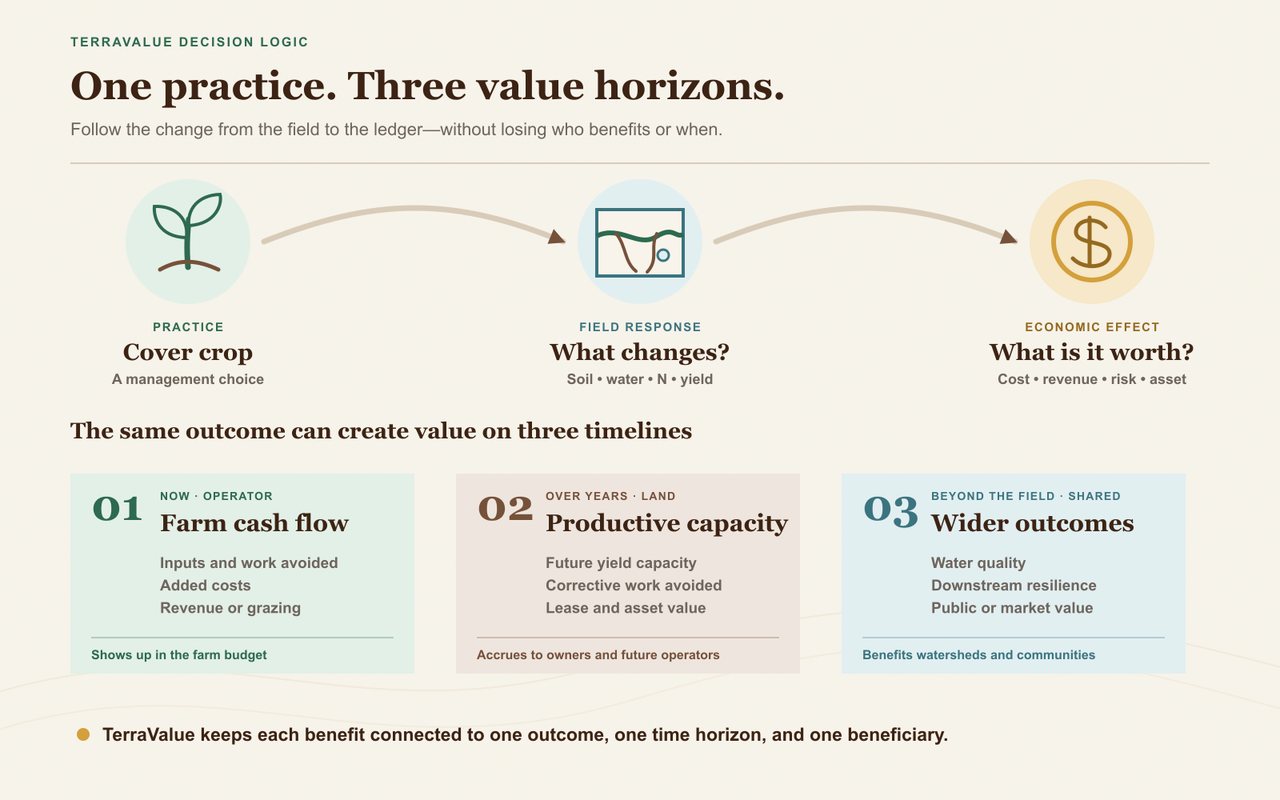
The immediate ledger records seed, planting, termination, fertilizer, forage, labor, and yield. The asset ledger records the productive capacity and future operating demands of the land. The shared ledger records outcomes such as cleaner water, carbon storage, habitat, and reduced downstream risk. One management decision can touch all three.
Start with the value we can trace
Brian’s calculation offers a useful starting point. Using the assumptions in his comment:
Illustrative nutrient replacement estimate
| Contribution | Calculation | Estimated replacement value |
|---|---|---|
| Nutrients in soil retained | 5 tons/acre/year × 60% erosion reduction × $10/ton | $30.00/acre/year |
| Nitrogen retained from leaching | 15 lb N/acre/year × 40% loss reduction × $0.70/lb N | $4.20/acre/year |
| Combined estimate | $30.00 + $4.20 | $34.20/acre/year |
The importance of the $34.20 is not that every field should use it. Its importance is that the chain can be inspected: an erosion baseline, a practice effect, a physical quantity retained, and an economic interpretation. Replace any assumption with measured or locally calibrated information and the result updates. That is how a general estimate becomes field intelligence.
Different values answer different questions. The $4.20 represents the assumed replacement value of six pounds of nitrogen retained. Immediate cash savings depend on how much of that nitrogen substitutes for fertilizer that would otherwise be purchased in the same season. If 40% does, the bill effect is 6 × 0.40 × $0.70 = $1.68 per acre. Decomposition, immobilization, weather, and crop demand determine that fraction; UC Agriculture and Natural Resources explains the relevant nutrient-cycling processes.
Resilience belongs in the same analysis. Suppose a damaging dry season has a 20% annual probability and a practice reduces the yield loss in that season by 20 bushels per acre. At an assumed crop price of $4 per bushel, the expected annual gross-revenue benefit is 0.20 × 20 × $4 = $16 per acre.
A TerraValue model would not stop with that average. It would compare favorable, typical, and damaging seasons; include any yield or harvest-cost effects in each; and show which assumptions drive the decision. The goal is a range the user can act on, not a single number detached from the field.
The same discipline prevents double counting. If better soil biology improves nutrient supply or yield, the value belongs in the supported fertilizer or production outcome. Pricing the biological indicator again would create a second copy of the same benefit. A credible natural-capital ledger preserves the causal relationship.
Break-even turns an argument into a decision
Now consider an illustrative annual farm budget. Assume $40 per acre in additional establishment, termination, labor, and operating costs; no other crop-revenue effect; and the $1.68 fertilizer saving and $16 expected resilience benefit above.
Illustrative annual farm budget
| Hypothetical scenario | Calculation, $/acre/year | Expected change in farm net return |
|---|---|---|
| Practice without a payment or grazing | 1.68 + 16 − 40 | −$22.32 |
| Same practice with a $25 net incentive payment | 1.68 + 16 + 25 − 40 | +$2.68 |
| Same practice with $30 additional net grazing benefit, without the incentive | 1.68 + 16 + 30 − 40 | +$7.68 |
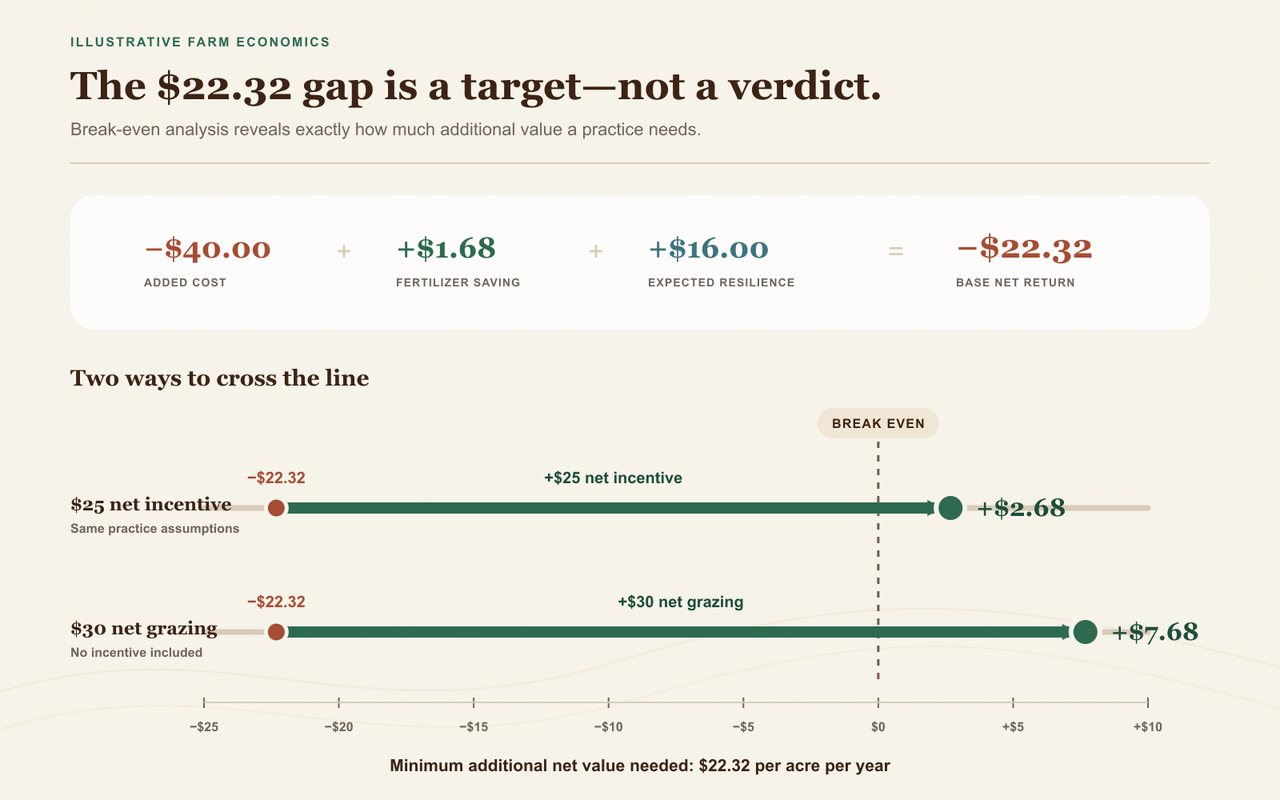
The negative first-year result is not a verdict against the practice. It is a price tag on the gap. It tells the farmer, adviser, landowner, and potential funding partner exactly what must change: lower establishment cost, a stronger production response, grazing value, a longer time horizon, or outside payment for a benefit someone else receives.
That is a more productive question than asking whether cover crops pay in the abstract. SARE’s cover-crop economics work shows why grazing, weed pressure, fertilizer costs, incentives, and management circumstances change the result.
Time and tenure matter as much as the annual average. A ten-year improvement has different economic meaning for an owner-operator, a landowner, and a tenant with a short lease. TerraValue can make that allocation visible, giving the parties a basis for a longer lease, a cost-sharing agreement, or a stewardship premium.
TerraValue connects the evidence into one field decision
TerraValue is not starting from an empty scientific landscape. Strong tools already estimate individual parts of the system:
Available resources and their roles
| Available resource | What it contributes |
|---|---|
| USDA RUSLE2 | Estimates rill and interrill soil erosion caused by rainfall and runoff under different conditions and management. |
| COMET-Planner | Provides generalized greenhouse-gas estimates for initial conservation planning. |
| Stanford’s InVEST suite | Provides open-source models for mapping and valuing multiple ecosystem services. |
| SARE’s cover crop economics resources | Connect practice costs and potential returns with particular farm-management situations. |
The opportunity is orchestration. These tools have different purposes, scales, data needs, and definitions. TerraValue’s platform design brings field context, connected scientific models, economic assumptions, scenario comparison, and an outcome ledger into one decision workflow.
The result should let a user move from “cover crops are good” or “cover crops do not pay” to a field-specific answer: this practice, on this field, under these weather and price conditions, creates this range of farm returns and these additional outcomes over this period of time.
The next step is a digital twin of the field
A digital twin is more than a stored field record or a dashboard. In agriculture, the term describes a virtual representation that connects observations, models, and simulation so a physical system can be monitored, tested, and improved. Reviews of digital twins in agriculture identify the combination of data, modeling, and “what-if” simulation as their central decision-making potential.
For TerraValue, the field digital twin would begin with place: soil, slope, drainage, weather, crop history, management, equipment, input costs, yields, and ownership or lease horizon. It would then run competing futures through the same field context.
What happens if cereal rye is planted after corn rather than soybeans? What if termination moves seven days earlier? What if fertilizer rises to $0.90 per pound, corn falls to $3.50, or spring rainfall moves into the wettest historical quartile? What changes if reduced tillage, a different rotation, irrigation scheduling, or a habitat strip is added?
The twin would compare expected net return, downside exposure, soil and water outcomes, payback period, and confidence across those scenarios. After the season, observed costs, weather, yield, soil measurements, and management changes would flow back into the field record. Each cycle would make the next comparison more specific to that field and more useful across similar fields.
True direction does not require pretending the future is certain. It means showing which choice remains strongest across plausible futures, what could reverse the result, and which next measurement is worth buying.
The current TerraValue platform is the first operational layer of that twin: structured field context, connected models, scenario comparison, and an outcome ledger. The next phase is to deepen it with live data, field calibration, longitudinal records, and partner validation. The destination is a decision engine that learns from what actually happens on the land.
From hidden value to an ecosystem dividend
Better decisions are the first market. They are not the last.
Many benefits produced on farms are public or shared goods. Cleaner water, flood buffering, habitat, carbon storage, and regional resilience can benefit people and institutions that never enter a transaction with the farmer. USDA has long noted that farmers may receive little financial return for producing environmental services that society values, and it now recognizes active or pilot environmental markets for greenhouse gases, water quality, water quantity, wetlands, and habitat. FAO describes payments for ecosystem services as one way to give land managers a positive incentive to maintain and improve those services.
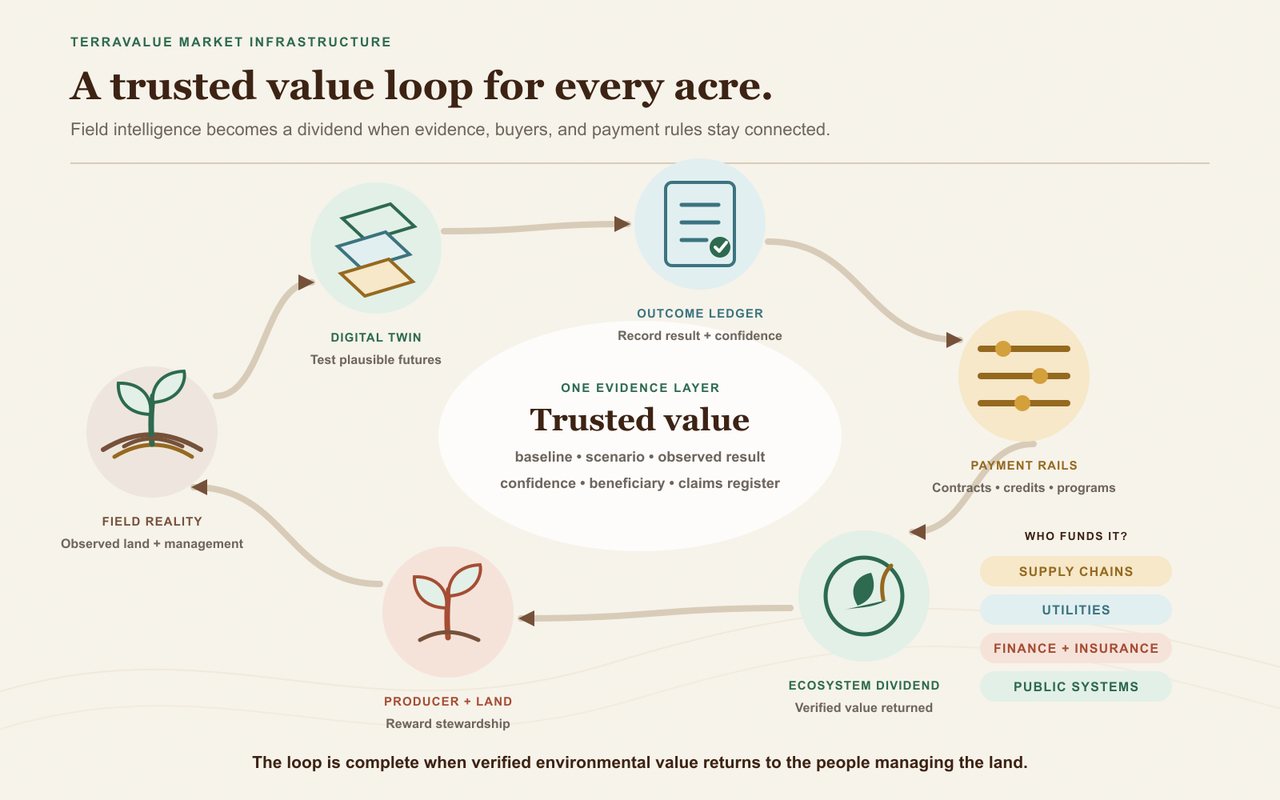
TerraValue’s larger ambition is to supply the measurement and settlement layer for an ecosystem dividend: a recurring return to the people who create and maintain verified environmental value.
That return could be funded several ways. A food company could pay a procurement premium for documented supply-chain outcomes. A water utility could contract for nutrient reductions that cost less than additional treatment. A lender or insurer could share part of a demonstrated risk reduction. A public program could pay for outcomes rather than a practice checklist. An environmental market could purchase verified carbon, water, or habitat units. EPA’s water-quality trading framework already shows how regulated buyers can purchase qualified reductions from farms and other sources when the result meets water-quality requirements.
An ecosystem tax or levy is the public-policy version of the same value loop. A government could place a charge on a defined source of pollution, resource depletion, or ecological damage. An ecosystem dividend is the return side: all or a defined share of that revenue flows to producers and land stewards who deliver measured improvements. Public institutions would establish the authority and rules for a levy; TerraValue could provide the field baselines, scenario models, outcome records, verification logic, and payment allocation needed to make the dividend credible.
A tax is not the only path. Voluntary purchases, supply-chain contracts, avoided-cost agreements, public conservation funds, premiums, and finance incentives can all feed the same dividend rails. The durable opportunity is a market in which environmental value is measured consistently, buyers understand what they are purchasing, and the people managing the land receive a fair share of the return.
The market is larger than a carbon credit
Carbon is one outcome. The broader commercial opportunity is the decision and evidence infrastructure surrounding the acre.
TerraValue's potential market layers
| Market layer | Primary users or buyers | Value TerraValue can unlock |
|---|---|---|
| Farm decision intelligence | Producers and advisers | Better practice selection, lower transition risk, clearer ROI and payback |
| Land and finance intelligence | Landowners, lenders, insurers, and investors | Stronger leases, asset stewardship, risk pricing, and resilience evidence |
| Supply-chain outcomes | Food, fiber, and fuel companies | Field-level insetting, procurement programs, and auditable portfolio progress |
| Environmental outcome markets | Utilities, public programs, project developers, and regulated buyers | Comparable carbon, nutrient, water, habitat, and resilience outcomes |
| Ecosystem-dividend infrastructure | Public institutions, collective buyers, and land stewards | Rules and settlement records that return verified value to the people managing land |
These layers reinforce one another. A field twin improves the farm decision. The decision creates an outcome record. Comparable outcome records make portfolios legible. Legible portfolios attract buyers and capital. Transactions fund more adoption and measurement, and the observed results improve the twins.
Market integrity is the foundation of that flywheel. Every outcome needs a baseline, a defined time period, a method, a confidence range, a beneficiary, and a record of whether it has already been claimed or sold. TerraValue’s natural-capital ledger is designed to make those relationships visible so one benefit can support several decisions without being sold several times.
What TerraValue should make possible
Imagine a farmer asking:
“Which of my fields should I prioritize for cover crops, what would make the investment break even, how does the answer change under dry and wet years, and who could pay for the value that does not return through my crop budget?”
A useful TerraValue result would rank fields, compare management scenarios, show expected farm returns and downside exposure, identify the time to payback, and separate private value from shared value. It would reveal which assumption controls the decision and which measurement would most improve the answer.
Each result would carry its sources, field inputs, model versions, assumptions, time horizon, and confidence. Where an outcome can be measured but a defensible price has not yet emerged, TerraValue can preserve it in physical units—pounds of nitrogen retained, tons of soil conserved, gallons of water saved, habitat acres supported—until a contract, program, or market supplies the price. That discipline protects the future value of the outcome instead of forcing it into an invented dollar figure today.
The same record can serve several conversations: a farmer choosing a practice, a tenant negotiating a lease, a landowner evaluating stewardship, a researcher selecting a validation site, a lender examining risk, a company building a supply program, or a public agency paying for outcomes.
Build the evidence network now
TerraValue is at the prototype and model-development stage. That is not a reason to make the vision smaller. It is the moment to build the field partnerships, data architecture, model calibration, and independent review that allow the vision to scale.
Paired field comparisons, practice-cost records, yield histories, soil measurements, weather, water observations, and management timelines can all strengthen the system. Successful practices show where the model works. Disappointing results reveal constraints, thresholds, and missing variables. Both make the digital twin more useful.
If you manage or advise farms, tell us about one decision you wish you could evaluate more confidently. Which fields would you compare? What records already exist? What result would change a management decision, a lease conversation, or an application for support?
If you work in research, finance, insurance, supply chains, utilities, conservation, or public policy, tell us what evidence would make a field outcome usable in your decisions. TerraValue’s market will be built where a credible farm result meets a real buyer, beneficiary, or risk holder.
If you have field comparisons or longitudinal records, talk with us about helping build and test the digital-twin layer. We can identify a focused validation question and agree on data use before information is shared.
Explore TerraValue, share your use case, or join the pilot conversation.
Soil has always carried economic value. TerraValue’s work is to make that value legible, simulate how it changes, and build the market rails that can return a fair share to the people who steward it.