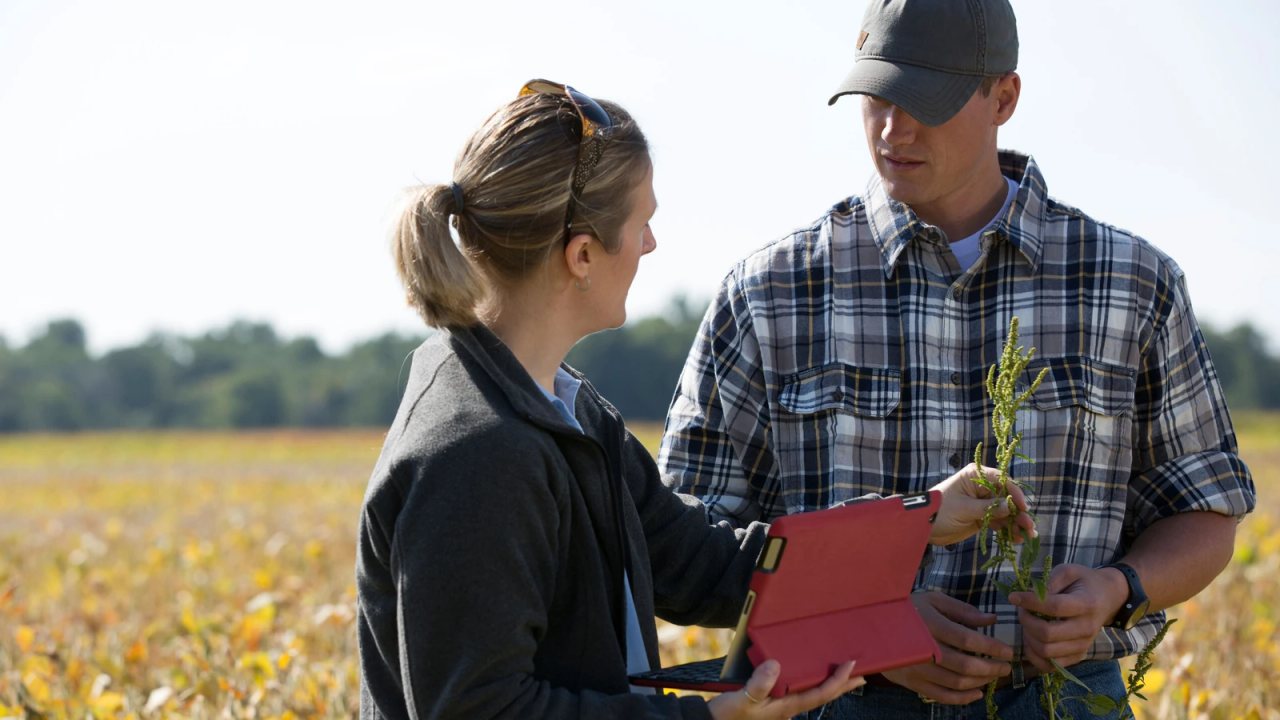
A dense patch of yellow nutsedge follows a low swale. Prostrate knotweed traces a gateway and the path of loaded grain carts. Pigweed towers in one dark-green band below an old manure loading area. These patterns are not random—but neither are they diagnoses.
Treat a weed as a clue, not a soil test
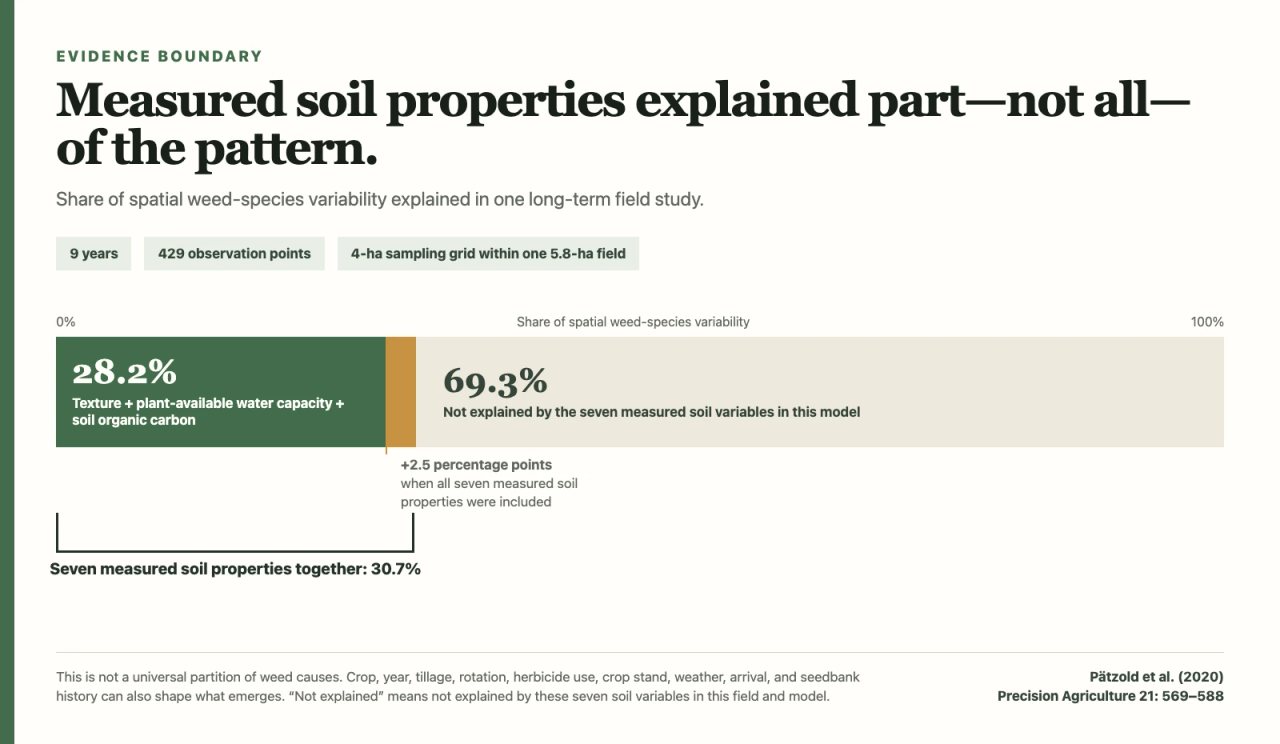
Weed communities do respond to soil. In a nine-year field study, texture, plant-available water, soil organic carbon, and related soil properties explained a meaningful share of spatial weed variability. But they did not explain all of it, and the authors emphasized that weed occurrence also changes with crop, year, tillage, rotation, herbicide use, and crop stand. [2]
A survey of nearly 700 arable fields found that current crop and preceding crop were the two strongest gradients in weed-community composition; soil pH and texture followed. [1] Other long-term work shows that the emerged flora can respond quickly to recent inputs, while the buried seedbank carries a longer memory of the field. [3] That is the central caution: a plant may reflect current soil conditions, past management, a recent weather window, imported seed, or several of these at once.
Three filters determine which weeds you see
| Filter | The field question | Examples |
|---|---|---|
| Arrival and memory | Could the plant reach this spot, or was it already in the seedbank? | Old seedbank, tubers, rhizomes, manure, hay, floodwater, equipment |
| Site fit | Could it germinate and compete under these conditions? | Moisture, oxygen, temperature, pH, nutrients, texture, salinity, light |
| Management selection | What repeatedly removed competitors but spared this plant? | Crop sequence, tillage depth, planting date, canopy, mowing, herbicide program |
Start with the pattern, not the plant
One plant is an observation. A repeated spatial pattern is a testable clue. Before digging or sampling, step far enough back to see the patch boundary and ask what it follows.
- Does the patch follow a low spot, drainageway, seep, tile failure, or irrigation line?
- Does it trace wheel tracks, headlands, gates, livestock lanes, or loading areas?
- Does it match an old fence, manure band, feed pile, burn pile, or fertilizer overlap?
- Is it limited to the crop row, interrow, residue gap, tillage strip, or compacted edge?
- Did it appear after one herbicide pass, cultivation pass, mowing event, flood, drought, or planting-date change?
- Does the same pattern return in the same location across seasons?
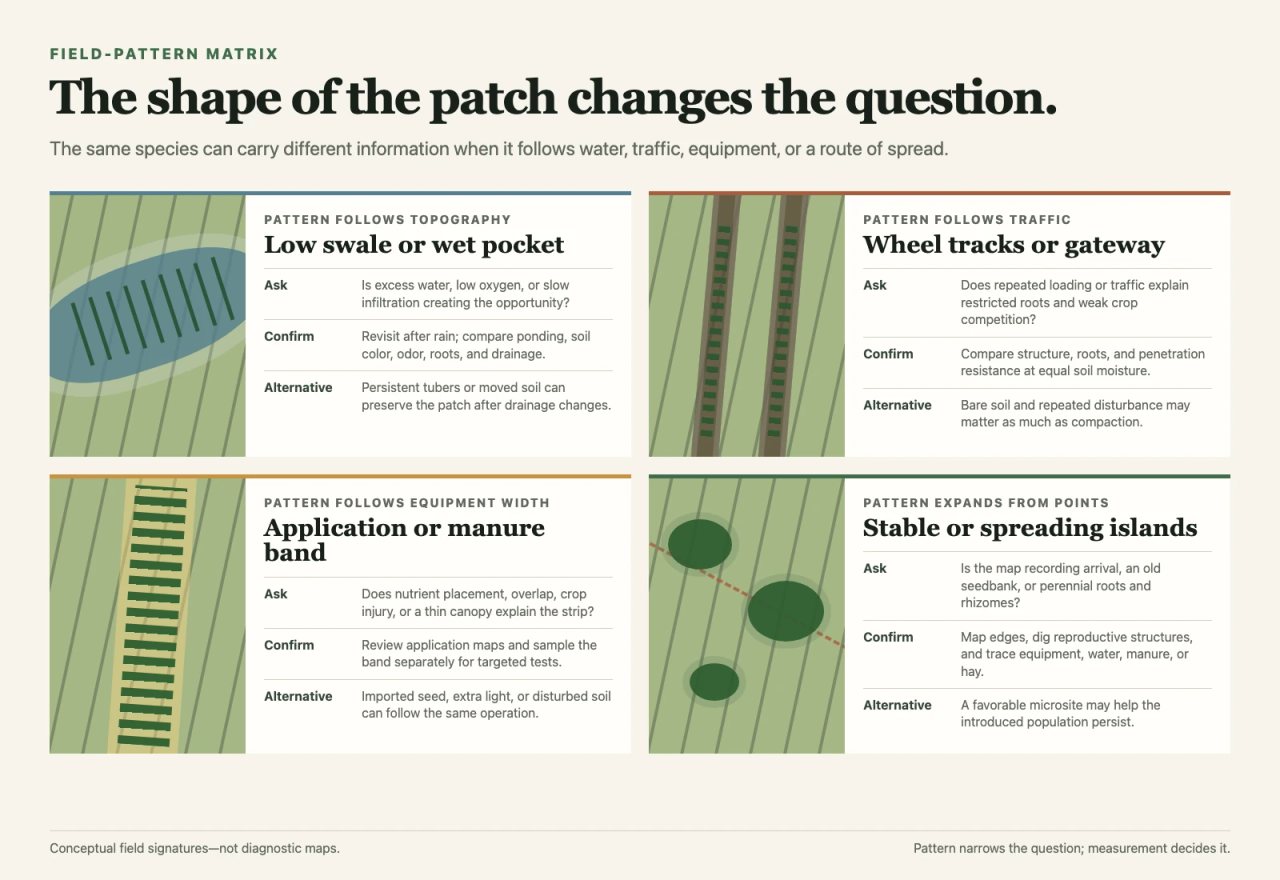
A field clue matrix
Turn the weed pattern into a testable hypothesis
| Observed pattern | Possible examples | Working hypothesis | Verify next | Important alternative |
|---|---|---|---|---|
| Low swales, wet pockets, irrigation lines | Yellow nutsedge, sedges, moisture-favoring smartweeds | Persistent wetness, poor drainage, slow infiltration, irrigation leak | Revisit after rain; inspect ponding, tiles, soil color and odor, root depth | Nutsedge tubers may have arrived in moved soil and can persist after drainage improves |
| Gateways, headlands, wheel tracks, paths | Prostrate knotweed; sometimes plantain or goosegrass | Surface or subsurface compaction, low aeration, repeated traffic | Compare roots and structure; use a penetrometer at comparable moisture | Bare soil and repeated disturbance may be as important as compaction |
| Manure, feeding, loading, or fertilizer-overlap bands | Lambsquarters, pigweeds, barnyardgrass | Nutrient enrichment or a vigorous response to available nitrogen | Sample the band separately for pH, nitrate, EC, P and K; review application maps | Extra light, bare soil, or imported seed may explain the same band |
Five common field patterns
1. Yellow nutsedge: check both water and field history
Yellow nutsedge thrives in moist, poorly drained soil, so a patch aligned with a wet depression or leaking irrigation line deserves a drainage investigation. [8] But the species spreads mainly through underground rhizomes and tubers and is often introduced in contaminated soil. A nutsedge patch can therefore reveal both a favorable wet microsite and the historical location of imported tubers. Killing the tops does not diagnose or remove either cause.
2. Prostrate knotweed: strongest when it traces traffic
Prostrate knotweed is well adapted to compacted, heavily trafficked ground. [7] Its signal is most persuasive when a low mat follows a gate, headland, cart path, or tire line. Confirm the hypothesis with crop-root shape, soil structure, and paired penetration-resistance measurements. Do not compare a dry wheel track with a moist non-trafficked area: penetrometer resistance changes sharply with water content. [10]
3. Lambsquarters and pigweeds: verify fertility with a soil test
Long-term fertility research shows that nutrient management can filter weed communities, and redroot pigweed and some other weeds respond strongly to nitrogen. [4] That makes vigorous patches around feeding areas or manure overlaps worth testing. It does not make plant height a nitrate test. These species also exploit warm soil, light, disturbed seedbeds, thin crop stands, and old seedbanks. Sample the patch separately before changing the fertility program.
4. Sorrel and plantain: measure pH before amending
Popular indicator lists often associate sorrel or plantain with acidity, low fertility, compaction, or—in another guide—a different pH condition. [6][14] This is not necessarily an error in observation; species, subspecies, turf density, climate, and co-occurring stresses differ. It is evidence that a weed is too broad a pH instrument for an amendment decision. If the hypothesis is acidity, collect a representative soil sample and measure pH and buffer requirement.
5. One surviving species: check the treatment history
When most target weeds are controlled and one species or patch survives, the field may be revealing selection pressure rather than soil condition. Repeated use of the same effective site of action can shift a population toward resistance, but poor coverage, wrong growth stage, weather, rate, antagonism, or later emergence can create a similar appearance. [11] Record the pattern and prevent seed production, then work through the treatment history before declaring resistance.
Why the same weed can mean different things
- Seedbank legacy: buried seeds can outlast the management that created the infestation. Tillage changes burial, dormancy, predation, and which seed sizes emerge. [5]
- Arrival: manure, hay, animals, floodwater, wind, and dirty equipment can place a weed in an otherwise ordinary soil. [4]
- Season and weather: soil temperature, rainfall timing, drought, and crop establishment alter which germination cohorts succeed.
- Crop and canopy: winter versus spring crops, crop sequence, row spacing, vigor, and planting date change light and competition. [1][15]
- Disturbance: tillage depth, stale seedbeds, cultivation, wheel traffic, and residue movement create different recruitment zones. [5]
- Control selection: herbicides, mowing, grazing, hand removal, and cultivation remove some species and life stages while sparing others. [11]
- Soil interactions: moisture, oxygen, texture, organic carbon, nutrients, pH, and salinity interact, so one apparent cause may stand in for several linked conditions. [2]
A 20-minute field investigation
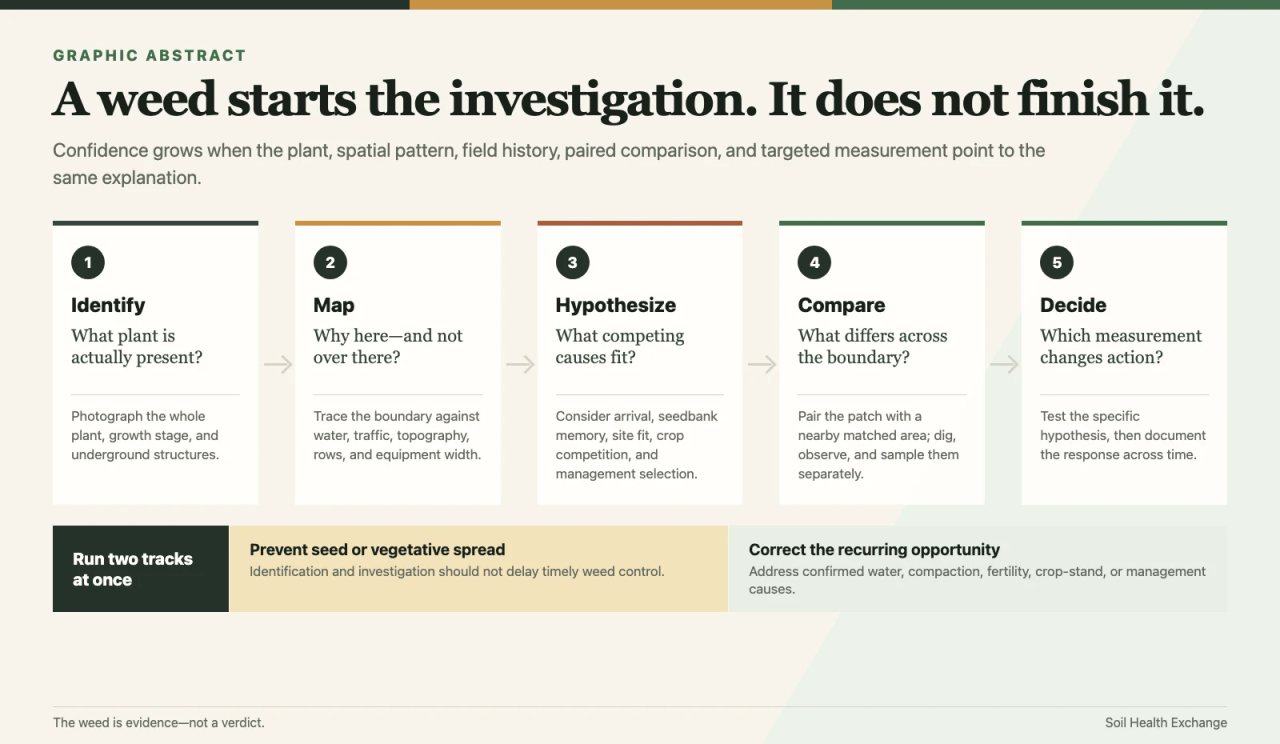
- Confirm the identification. Photograph the whole plant, leaf arrangement, stem, flower or seedhead, and underground structures. Use a regional key or Extension service when uncertain.
- Map the boundary. Walk the perimeter or mark it on an aerial image. Record whether it follows topography, traffic, rows, equipment width, water movement, or an old field feature.
- Choose a paired comparison. Select a nearby area with the same soil map unit, slope position, crop, and management—but little or none of the weed.
- Record the recent story. Note rainfall, irrigation, tillage, manure and fertilizer, traffic, crop stand, herbicide timing, mowing, grazing, and previous crops.
- Dig both areas. Compare surface crust, aggregation, smell, moisture, root abundance and direction, restrictive layers, residue, and biological activity. NRCS recommends looking below the surface at more than one location. [9]
- Measure the suspected mechanism. Use the smallest set of observations or tests that can distinguish the leading explanations.
- Control the weed on time. Diagnosis should not become permission for seed production or perennial spread. Photograph and sample first, then use an appropriate integrated control plan.
- Return under another condition. Revisit after a rain, during a dry period, or in the next crop. A real site relationship should become clearer across observations.
Match the hypothesis to the measurement
Do not order a broad panel when one comparison can answer the question
| Hypothesis | Field check | Targeted measurement | Sampling caution |
|---|---|---|---|
| Excess water or low oxygen | Ponding after rain, mottling, odor, shallow or missing fine roots | Infiltration, profile moisture, drainage or tile inspection | Observe both wet and normal periods; one storm can mislead |
| Compaction | Horizontal, flattened, or J-shaped roots; platy or massive structure | Paired penetrometer readings at field capacity; bulk density if needed | Soil moisture must be comparable; take multiple readings in and out of traffic |
| pH difference | Crop symptoms and species pattern | Laboratory pH plus buffer test where locally recommended | Sample patch and comparison separately at the same depth |
| Nutrient hot spot | Dark crop color, lodging, old feeding or manure pattern | Nitrate or locally appropriate N test; P, K, pH and EC as relevant | Recent application and moisture timing affect results |
| Salinity or sodicity | Poor crop stand, crusting, salt-tolerant volunteers, landscape accumulation zone |
How to sample a weed patch without averaging it away
A composite sample that mixes the patch with the normal field may erase the contrast you are trying to explain. Soil-sampling guidance emphasizes keeping visibly different soils, topography, and management areas separate. [12] Use a paired design instead.
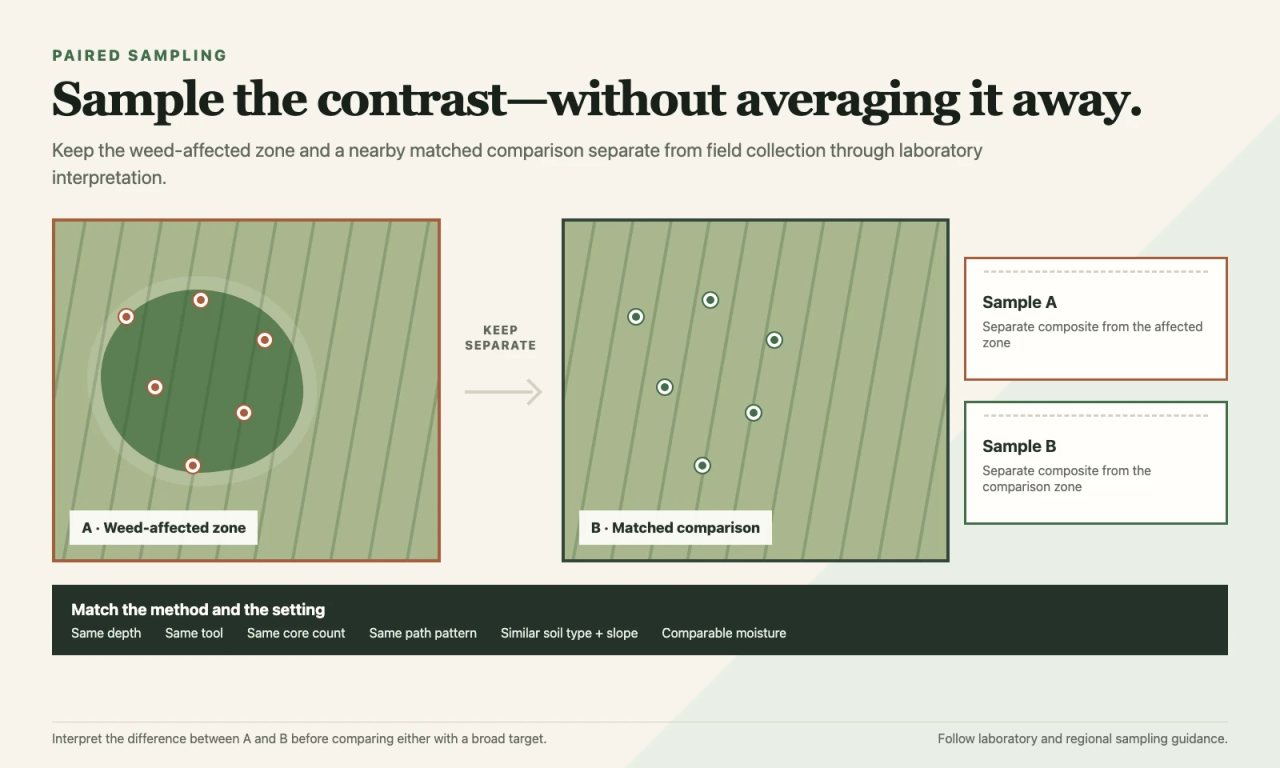
- Outline the weed-affected zone and a nearby comparison zone with similar slope position and soil type.
- Collect a separate composite from each zone using the same depth, tool, core count, and path pattern recommended by the laboratory.
- Avoid fertilizer bands, individual manure clumps, field edges, and wheel tracks unless one of those features is the subject of the diagnosis.
- Label the samples as a pair and record GPS points, photographs, crop condition, soil moisture, and recent operations.
- Interpret the difference between the zones before comparing either result with a broad regional target.
Management: correct the cause and prevent seed return
The diagnostic and weed-control tracks should run in parallel. Correcting drainage will not empty a nutsedge tuber bank. Relieving compaction will not remove mature knotweed seed. Killing a weed without changing the recurring opportunity may leave the field ready for the next cohort.
What to do this week
A rapid action guide for weed patterns
| Pattern observed | Immediate action | Confirm the cause | Longer-term response |
|---|---|---|---|
| Patch follows a low swale or wet pocket | Map the patch and prevent seed, tuber, or rhizome spread | Revisit after rain; inspect ponding, drainage outlets or tile, root condition, and soil odor | Correct the water problem where feasible and manage the established weed with a separate species-appropriate plan |
| Patch follows wheel tracks, gateways, or repeated traffic | Mark the traffic zone and avoid additional passes when wet | At similar soil moisture, compare roots, structure, and penetration resistance with a nearby unaffected area | Reduce wet traffic, axle load, tire pressure, or repeated passes; loosen soil only when a restriction and its depth are confirmed |
| Growth follows a fertilizer or manure band | Review application width, overlaps, placement, and field records | Sample the band and a matched comparison separately; do not infer a nutrient rate from the weed | Correct calibration or placement and strengthen crop competition; base nutrient changes on testing and crop need |
| Plants survived a control treatment | Prevent seed production or vegetative spread now | Check species, growth stage, coverage, weather, rate, label, and site of action; document the survivor pattern |
If the evidence points to excess water
Inspect irrigation leaks, surface flow, tile function, traffic damage, and whether tillage has created a restrictive layer. Improve the water problem where practical, but manage established sedges or other perennials with a species-appropriate plan before new tubers, rhizomes, or seed accumulate.
If the evidence points to compaction
First remove the cause: avoid traffic when wet, control axle load and tire pressure, confine traffic where feasible, and build rooting and aggregation over time. Deep tillage should follow a confirmed depth and extent of restriction, not a weed name; Penn State recommends setting a subsoiler just below a diagnosed compacted zone and treating subsoiling as a last resort rather than an annual habit. [10]
If the evidence points to a fertility hot spot
Correct spreader calibration, overlap, feed or manure placement, and crop competition before applying more nutrients. A vigorous nitrophilic weed is not evidence that the crop needs the same nutrient. Where residual nitrogen is the concern, a well-timed scavenging crop may help, but the species, planting window, and next-crop plan still matter.
If the evidence points to bare soil and repeated disturbance
Close the recruitment window: improve crop establishment, rotate planting dates and crop life cycles, preserve residue where it fits, use cover crops with a defined termination plan, and time cultivation to the vulnerable seedling stage. Cropping-system diversity changes weed-community composition because it changes the filters weeds must pass. [15]
If the pattern points to management survivors
Prevent seed production and use multiple effective tactics. Confirm herbicide sites of action rather than counting trade names, integrate cultural and mechanical tools where they fit, clean equipment before leaving infested fields, and use Extension testing when resistance is suspected. [11] A soil-health practice is not automatically a weed-management program; the two plans have to be designed together.
What weeds cannot tell you
- The exact soil pH, nitrate concentration, phosphorus level, bulk density, or salinity.
- Whether lime, fertilizer, gypsum, compost, biochar, or another amendment will pay.
- Whether the whole field is “healthy” or “unhealthy.” A patch may reveal one function in one zone.
- Whether the soil condition caused the weed or merely allowed a seedbank already present to express itself.
- Whether a survivor is herbicide-resistant based on appearance alone.
- Whether a one-season association will persist under a different crop, weather pattern, or management system.
A one-page observation record
Record the weed's abundance and growth stage along with the crop, recent weather, management history, and planned follow-up. A consistent scouting record is more useful than trying to reconstruct the pattern after the season [13].
What to record before the weed is removed
| Record | Minimum useful detail |
|---|---|
| Identification | Common and scientific name if known; life cycle; photos of diagnostic structures |
| Pattern | Patch, band, row, wheel track, edge, low spot, or whole-field distribution |
| Abundance and stage | Scattered or dense; seedling, vegetative, flowering, or setting seed |
| Field context | Crop, stand density, residue, slope position, soil map unit |
| Recent conditions | Rainfall, irrigation, drought, temperature, and soil moisture |
| Management history | Rotation, tillage, traffic, manure, fertilizer, herbicide, mowing, grazing |
| Paired observations | Roots, structure, smell, moisture, infiltration, crop vigor inside and outside patch |
| Samples and action | Sample IDs, GPS/photo points, immediate control, cause-correction plan, revisit date |
When a weed patch appears
Weeds are among the most visible biological records a field produces. They integrate opportunity, stress, competition, disturbance, and history—but they do not separate those influences for us. The skill is not memorizing a dictionary of species and soil conditions. It is learning to see a pattern, form competing explanations, and collect the observation that can distinguish them.
The next time a weed patch catches your eye, mark it before you remove it. Ask why here, why now, and why this species. Compare it with a nearby area, dig in both places, measure the suspected cause, and return under another condition. Use what you find to decide what to test and what to change.