- Location
- WI
- Crop
- Corn
- Acres
- 1,000
The challenge
“How can we reasonably/accurately assess nitrogen credit from legume CC prior to corn?”

Musfiq Salehin, Ph.D.
Assistant Professor of Agronomy and Soil Fertility · New Mexico State University · Las Cruces, New Mexico
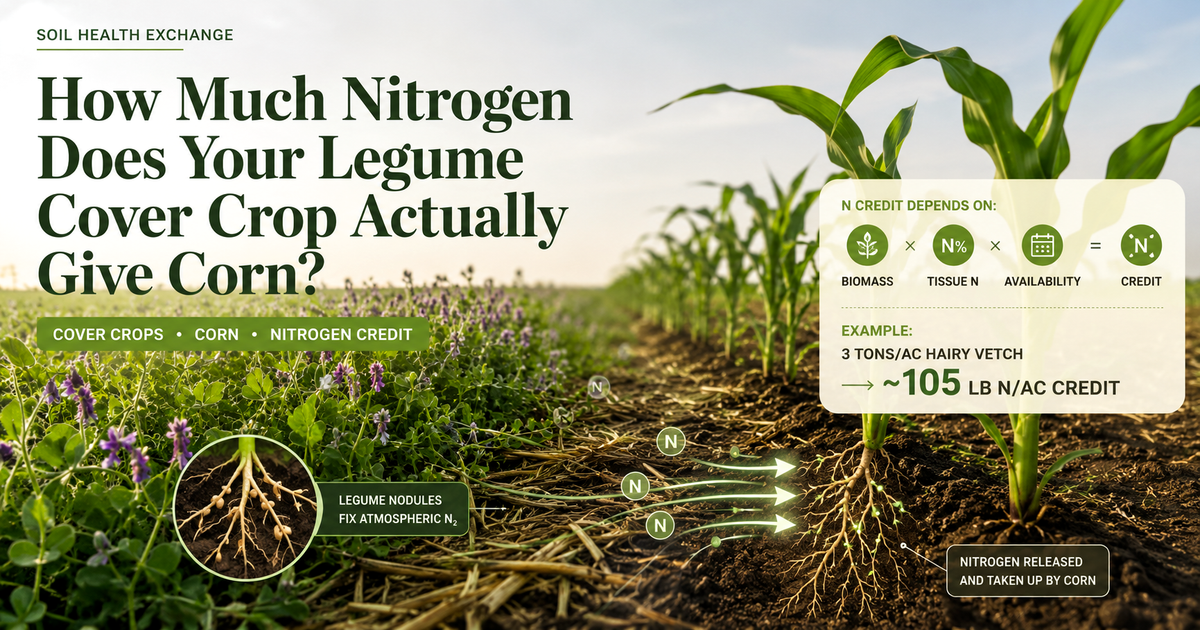
How a legume nitrogen credit works
A reasonable estimate of nitrogen credit from a legume cover crop prior to corn requires two pieces of information: how much dry aboveground biomass is present at termination and how much nitrogen is contained in that biomass. In general, the more biomass a legume cover crop produces, the greater its potential nitrogen contribution to the following corn crop.
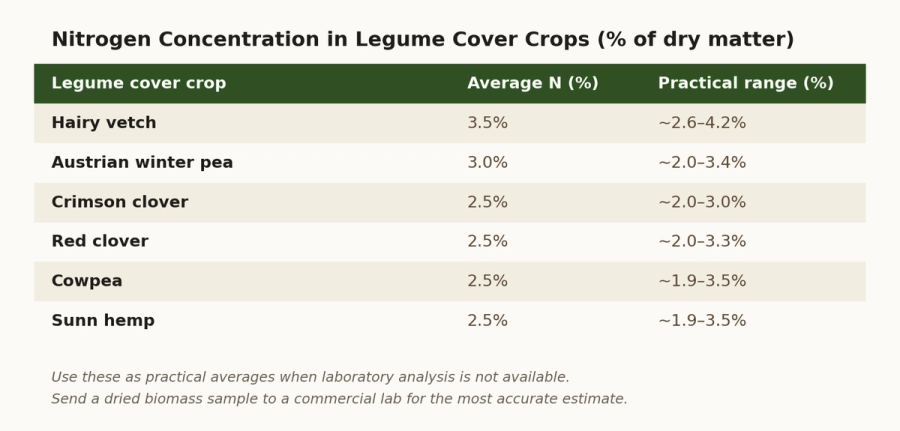
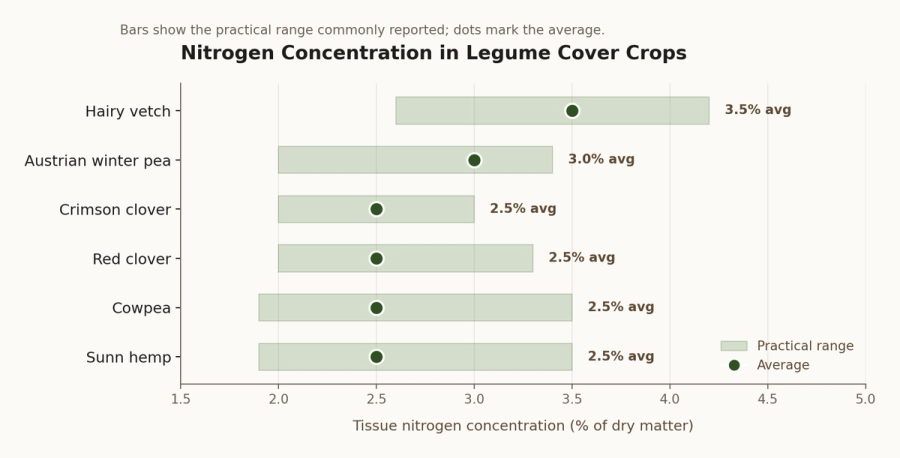
Legume cover crops are typically high in nitrogen because they can fix atmospheric nitrogen through biological nitrogen fixation. Their biomass nitrogen concentration varies by species, growth stage, and field conditions, but the values below provide practical averages for estimating nitrogen credit when laboratory analysis is not available.
Nitrogen concentration by species
How to estimate the credit, step by step
- Sample the legume cover crop biomass just before termination from 5–10 representative areas of the field using a 1 m × 1 m quadrat.
- Dry the biomass samples by air drying for 4–5 days or oven drying until the weight is stable.
- Calculate dry biomass production per acre from the average quadrat dry weight.
- Estimate biomass N concentration using the species-specific values in the table, or send a dried subsample to a commercial lab for total N analysis.
- Calculate total N contained in the biomass by multiplying dry biomass by biomass N concentration.
- Estimate the plant-available N credit as 50% of the total N contained in the legume biomass.
- Reduce the planned corn fertilizer N rate by the estimated cover crop N credit.
- Consider termination method and timing, since N release is generally faster when residue is incorporated and slower when residue remains on the soil surface in no-till systems.
The calculation
Two equations summarize the workflow above:
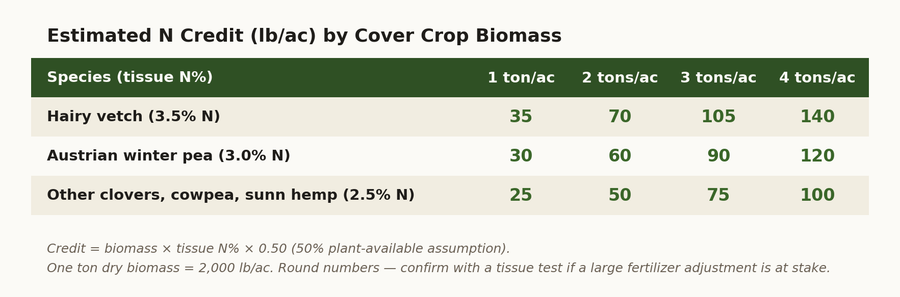
Total N in cover crop biomass = Dry biomass × Biomass N concentration
Estimated N credit = Total biomass N × 0.50
Worked example: 3 tons/acre of hairy vetch
If a hairy vetch cover crop produces 3 tons/ac of dry biomass, that equals 6,000 lb/ac of dry matter. Assuming an average tissue N concentration of 3.5%:
6,000 × 0.035 = 210 lb total N/ac
210 × 0.50 = 105 lb N/ac credit
Thus, a 3-ton/ac dry hairy vetch stand could reasonably provide about 105 lb N/ac of credit for corn. If the planned fertilizer N rate for corn was 200 lb N/ac, the adjusted rate after accounting for the cover crop credit would be:
200 − 105 = 95 lb fertilizer N/ac
When to send a sample to the lab
For the most accurate estimate, farmers should send a dried biomass sample to a commercial laboratory for total N analysis rather than relying only on average values. This is especially useful when the cover crop stand is unusually dense, mature, mixed with grasses, or when a large fertilizer adjustment is being considered.
Additional context from the editors
The information below is supplementary context compiled by the Soil Health Exchange editorial team to help you apply Dr. Salehin's framework.
Quick reference: N credit by biomass level
If you already know — or can estimate — your cover crop biomass, this table shortcuts the math for the most common species. Round numbers; use the formula in Dr. Salehin's section for any non-standard cases.
Field shortcut: estimating biomass without scales
When a quadrat sample isn't practical, these rough visual benchmarks (gathered from Midwest extension biomass studies) help you assign a biomass range to a stand:
- Hairy vetch or winter pea, mid-shin (~12") — at early bloom, uniform canopy: roughly 1.5–2 tons/ac dry biomass.
- Knee-high (~24") in late bloom — for vetch or pea: typically 3–4 tons/ac.
- Red or crimson clover, knee-high at peak flowering — denser stems, less open canopy: usually 2–2.5 tons/ac.
- Lodged or flopped stands — measure canopy depth (vertical accumulation), not standing height — biomass is often higher than it looks.
- Grass-legume mixes — visually estimate the legume share (often 30–50%) and apply the legume average only to that portion. Sample a known area if precision matters.
What can shift the credit up or down
Dr. Salehin's 50% availability assumption is a reasonable planning number. In practice, several factors push the actual delivered N higher or lower:
- C:N ratio of the residue — Pure legumes are typically C:N 15–25 and release N readily. Adding cereal rye, oats, or other grasses raises the C:N — above ~25:1 the residue can temporarily immobilize N during decomposition (especially the first 30–60 days). Discount the credit in heavy grass-legume mixes.
- Soil temperature and moisture — Warm, moist soils accelerate mineralization. A cold, wet spring can delay N release by several weeks — so even if the credit is "there," it may not be available when corn needs it most.
- Residue placement — Incorporated residue releases N faster and more uniformly. Surface residue in no-till releases slower and more variably.
- Termination timing — Past full bloom, biomass is higher but tissue is tougher (higher C:N) — more total N but slower release. Terminating earlier favors faster, smaller releases.
- Drought stress during cover crop growth — Stressed legumes fix less N and may concentrate it in roots. Aboveground biomass sampling can under-estimate (root N missed) or over-estimate (tissue concentration assumed average).
Did you get the credit right? — In-season checks
Three field checks during the corn season let you validate (or correct) the N credit you assumed:
- PSNT (Pre-Sidedress Nitrate Test) — Sample soil to 12" at V4–V6. >20–25 ppm NO₃-N usually indicates the cover crop credit plus soil supply is adequate; <15 ppm signals supplemental N is needed. The most direct in-season check.
- Visual corn assessment at V6–V8 — Pale, uniformly yellow lower leaves suggest under-credit. Deep green with no streaking suggests the N supply is meeting demand.
- Tissue test at V6 or VT — Whole-plant N below ~3.5% at V6, or ear-leaf N below ~2.7% at silking, indicates the system was short on N.
- Yield-map comparison — If you can run adjusted vs. unadjusted N strips, the season-end yield map is the truest measure of whether your credit assumption held.
Keep records — cover crop species, biomass estimate, weather, PSNT result, final yield — across 2–3 seasons. Your farm-specific credit number will become more accurate than any published table.
Cite this
Reference this work
Musfiq Salehin, Ph.D. (2026). How Much Nitrogen Does Your Legume Cover Crop Actually Give Corn?. Soil Health Exchange. SHE-FA-2026-0008. https://soilhealthexchange.com/cite/SHE-FA-2026-0008
Soil Health Exchange assigns a stable identifier to every published answer and article. Citations keep working even if the URL changes later.
Discussion
No comments yet. Be the first to share your thoughts!