45Z for Farmers: What Changed, What to Ask, and How to Evaluate an Offer
September 2026 guidance connects documented farm practices to the clean fuel credit. Learn what changed, what records buyers may need, and how to compare a written premium with your costs—without assuming a guaranteed per-acre payment.
Editor's Note
Updated September 17, 2026 against IRS Notice 2026-53, USDA’s June final rule, and DOE’s September model and manual. This revision replaces our earlier $16–$162 per-acre range and $71 “realistic” estimate: those scenarios were not a reliable forecast of farmer payments. The calculator now budgets a buyer’s quoted offer. Originally published May 2026; the original publication date is preserved. SHE has no affiliation with a 45Z enrollment program and does not receive a share of a farmer’s premium.
SH
By Soil Health Exchange Team||7 min read|159 reads
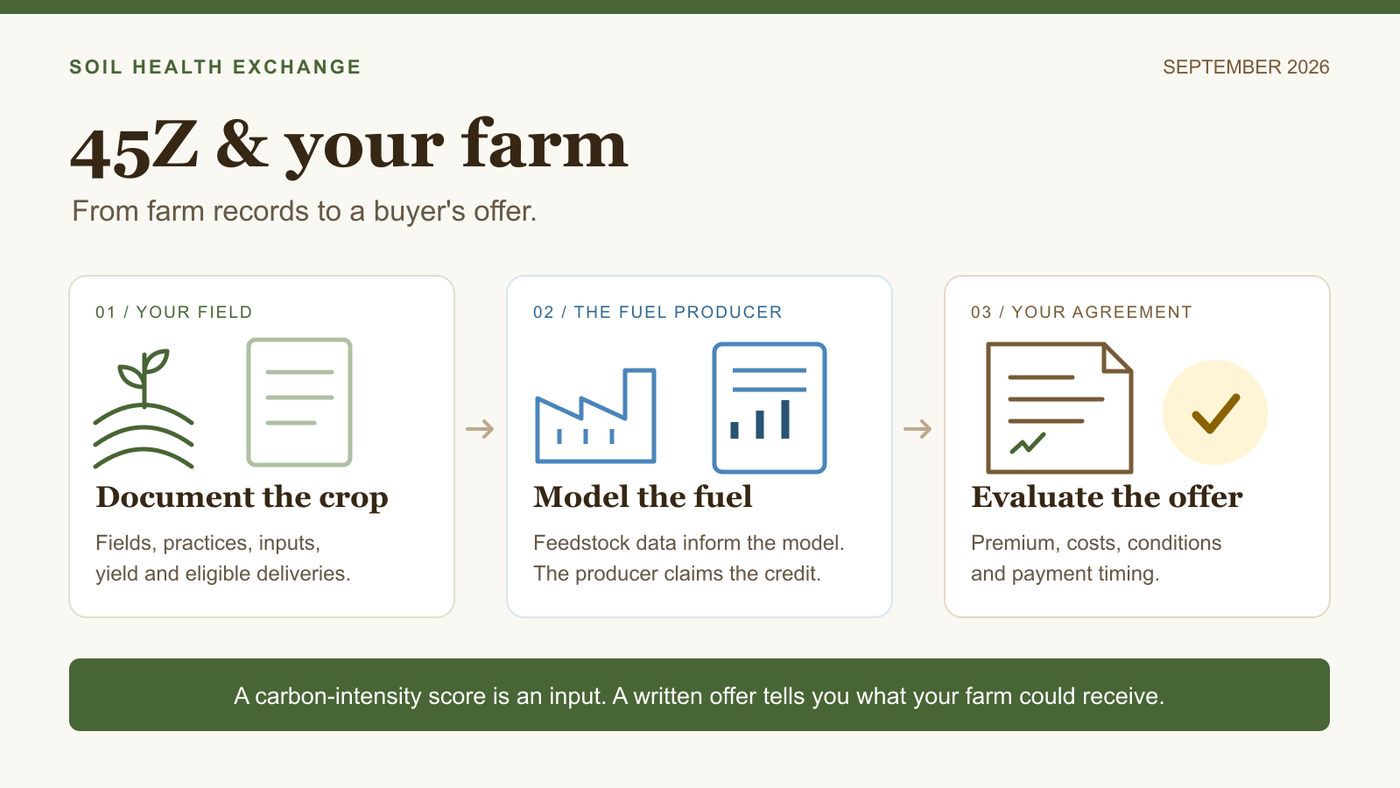
A lower-carbon crop can have value to a fuel producer. Whether that value reaches your farm depends on an agreement: which grain qualifies, how it is documented, what the buyer pays, and what participation costs you. A carbon-intensity score by itself is not a payment offer.
The practical change this September
There is now updated federal guidance and a September 45ZCF-GREET package that incorporates a 45Z-specific feedstock calculator. Farmers can ask buyers more specific questions about documented practices and eligible deliveries. There is still no universal farmer premium or guaranteed dollars per acre.
What changed—and what is still proposed
The timeline to use now
Development
Status as of September 17, 2026
Why a farmer should care
USDA feedstock technical guidelines
Final rule published June 29; effective July 29
Provides the framework for quantification, records, chain of custody, audit and verification.
IRS Notice 2026-53
Effective September 8
Provides the 2026 emissions-rate table and guidance for regenerative feedstock practices, including limited transition relief.
DOE 45ZCF-GREET
September 2026 model and manual published
Includes 45ZCF FD-CIC for modeling specified farm practices and passing feedstock results into fuel calculations.
Broader Treasury/IRS 45Z regulations
February 4 proposal remains a proposal in the guidance reviewed here
Do not describe the September notice as finalization of every 45Z regulation.
Sources: IRS Notice 2026-53 [1]; USDA final rule [2]; DOE manual and change log [3][4]; Treasury/IRS proposal [5].
The September DOE manual covers regenerative-practice adjustments for U.S.-grown corn, sorghum, soybeans and canola. Its listed practices include cover crops, tillage practices, nitrification inhibitors and manure application. The model’s crop and practice definitions matter; a general claim that a farm is “regenerative” does not establish eligibility for a particular adjustment. [3]
There are also different rules for different fuel production years. Notice 2026-53 explains that the 2026 changes include excluding indirect land-use-change emissions and requiring feedstocks grown or produced in the United States, Canada or Mexico. The broader feedstock-origin rule is not the same as access to the model’s U.S.-only regenerative-practice adjustments. Ask the buyer which production year and pathway it is using. [1]
Who receives the credit?
Section 45Z is a federal income tax credit for qualifying domestic clean-fuel production and qualified sales. The claimant is the qualifying fuel producer. A grower does not receive the credit simply by producing a lower-carbon crop, keeping records or enrolling with a platform. Any crop premium reaching that grower depends on the buyer’s commercial terms. The statutory credit currently covers qualifying fuel produced after December 31, 2024 and sold by December 31, 2029. [1]
A feedstock carbon-intensity result is one input to a fuel calculation. The fuel pathway, other production inputs, volumes, applicable model version and tax requirements also matter. This is why a universal “one CI point equals this many cents per bushel” shortcut is not an appropriate forecast of your payment. The official model calculates fuel emissions; your contract determines your compensation. [3]
The 2025–2026 records relief has limits
Notice 2026-53 permits the 2026 version of 45ZCF FD-CIC to account for specified farm practices for fuel produced in 2025, subject to the USDA technical guidelines, including chain-of-custody and audit/verification requirements. For fuel produced in 2025 and 2026, it also treats the pre-application nutrient-budget requirement as satisfied for 45Z purposes. [1]
That relief does not remove the need to substantiate nutrient applications and measurable nutrient sources and removals entered in the model, or the fuel producer’s obligation to substantiate its credit. Keep the underlying records. Have the buyer identify the relevant fuel production year; the date a crop was planted, harvested or sold is not automatically the fuel production date. [1]
Start with a written offer, then do the math
Before paying an enrollment fee or changing a practice for a premium, get an offer that identifies eligible acres and grain, a payment formula, deductions, acceptance conditions and timing. If compensation is a share of a credit, ask the buyer to show the calculation and explain who bears the risk of a lower credit, rejected records or a later adjustment. Do not insert an assumed “industry-standard” sharing percentage.
Offer comparison · Private to this page
What would a buyer’s offer be worth?
Compare a quoted premium with the costs of participating. This calculates a farm budget, not a tax credit or a carbon-intensity score. A buyer must first offer and accept your grain for a premium.
Illustrative numbers loaded — these are not market rates.
Use the written offer, above your normal grain price.
Only grain accepted for the premium, not necessarily all yield.
The acres associated with those eligible bushels.
Include practice changes, extra hauling and your time.
Verification, platform or enrollment fees; avoid double counting.
Net value of this scenario
$500.00
$5.00 per acre, before tax
Eligible bushels
20,000
Gross premium
$2,000.00
Added costs
$1,500.00
Break-even premium
$0.075/bu
This is a conditional budget, not expected earnings. Payment still depends on the agreement and accepted deliveries.
Gross premium = premium × eligible bushels per acre × acres. Net value subtracts per-acre and fixed costs. Excludes base grain revenue, income taxes and benefits or costs you have not entered. Nothing entered here is submitted or saved.
Here is an arithmetic example, not a market forecast: a $0.10/bushel premium on 200 eligible bushels per acre across 100 acres produces $2,000 gross. Added costs of $12/acre plus a $300 fixed fee total $1,500. That leaves $500, or $5/acre, before tax. The break-even premium is $0.075/bushel. At the same costs, a $0.05 premium produces a $500 loss. Replace every assumption with your offer and budget.
Count only grain eligible for the premium. If some production goes to another buyer, misses a delivery window or is rejected, gross premium falls. Include incremental transport, recordkeeping time, verification, platform fees and practice costs that you actually incur. Keep those separate from costs you would have incurred anyway. Account separately for other agronomic benefits, risks or cost savings; this calculator does not estimate them.
Seven questions to take to a buyer
What crop, harvest year, acres, practices and deliveries qualify? Is this a binding purchase offer, an enrollment agreement or only an estimate?
What is the premium above the otherwise available grain price, and can basis, quality deductions or freight changes offset it?
Which model, version and fuel production year will be used? Who calculates the feedstock result, verifies it and pays for that work?
Exactly which records, data permissions and chain-of-custody steps are required? Who keeps the records, who can access them, and for how long?
When is payment due? What happens if a verification fails, eligible volume is lower, the fuel credit changes or the buyer does not claim it?
Are environmental attributes exclusive? What restrictions apply to other programs or claims on the same crop or practice? Obtain the relevant terms from each program.
What are all fees, withdrawal terms and possible repayment obligations? Can the buyer provide a worked settlement example?
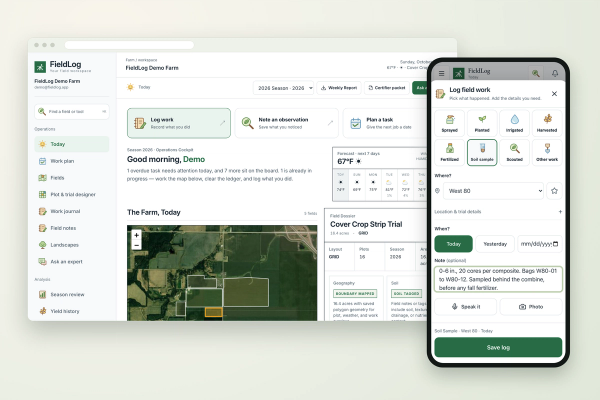
Build a records folder before you build expectations
USDA’s final guidelines establish a framework for documenting crop production, practices and supply-chain transactions, with audit and verification provisions. Requirements depend on the crop and practice being modeled. Use the buyer’s written checklist alongside the current official guidelines. [2]
A practical starting folder
Record group
Examples to gather
Confirm with the buyer
Field and crop
Field boundaries/IDs, crop year, acres and measured yield
Which management units and eligible volumes enter the calculation?
Practices and inputs
Dated tillage and cover-crop records; nutrient sources, rates, timing and inhibitor records where applicable
Which exact practice definitions and substantiation are required?
Movement and sales
Scale tickets, delivery records, purchaser and transaction identifiers
How does grain and its information remain traceable through the supply chain?
Commercial terms
Signed agreement, fee schedule, verification scope and payment statements
What determines acceptance, deductions and final payment?
This is an organizing aid, not an exhaustive compliance checklist. The USDA rule and the buyer’s specific program determine the required evidence [2].
Where soil health testing fits
CEMA 216 helps document soil-health measurements and their interpretation. It is a different activity from quantifying feedstock carbon intensity for 45Z. A CEMA report, soil-carbon measurement or SHE course certificate does not by itself establish 45Z eligibility, an accepted CI result or a premium. Use each tool for the decision it actually supports.
Ask one buyer you can realistically deliver to for a written eligibility checklist and a worked payment example. Put that offer through the budget above. If there is no offer yet, organize records you already have and assess practice changes on their agronomic merits; do not budget a promised premium as earned income.
Soil Health Exchange is a science-led platform connecting agricultural producers with evidence-based agronomic solutions, peer-reviewed research, and field-tested practice.
Source material for every claim in this article, plus a citation-ready record for reference managers and scholarly indexes.
Cite this
Reference this work
SHE-ART-2026-0006
Soil Health Exchange Team (2026). 45Z for Farmers: What Changed, What to Ask, and How to Evaluate an Offer. Soil Health Exchange. SHE-ART-2026-0006. https://soilhealthexchange.com/cite/SHE-ART-2026-0006
Soil Health Exchange Team (2026). 45Z for Farmers: What Changed, What to Ask, and How to Evaluate an Offer. Soil Health Exchange. https://soilhealthexchange.com/blog/45z-credit-what-farmers-can-realistically-expect
More citation formats
MLA
Soil Health Exchange Team. "45Z for Farmers: What Changed, What to Ask, and How to Evaluate an Offer." Soil Health Exchange, 2026-05-09, https://soilhealthexchange.com/blog/45z-credit-what-farmers-can-realistically-expect.
Chicago
Soil Health Exchange Team. "45Z for Farmers: What Changed, What to Ask, and How to Evaluate an Offer." Soil Health Exchange. Published 2026-05-09. https://soilhealthexchange.com/blog/45z-credit-what-farmers-can-realistically-expect.
Discussion
No comments yet. Be the first to share your thoughts!