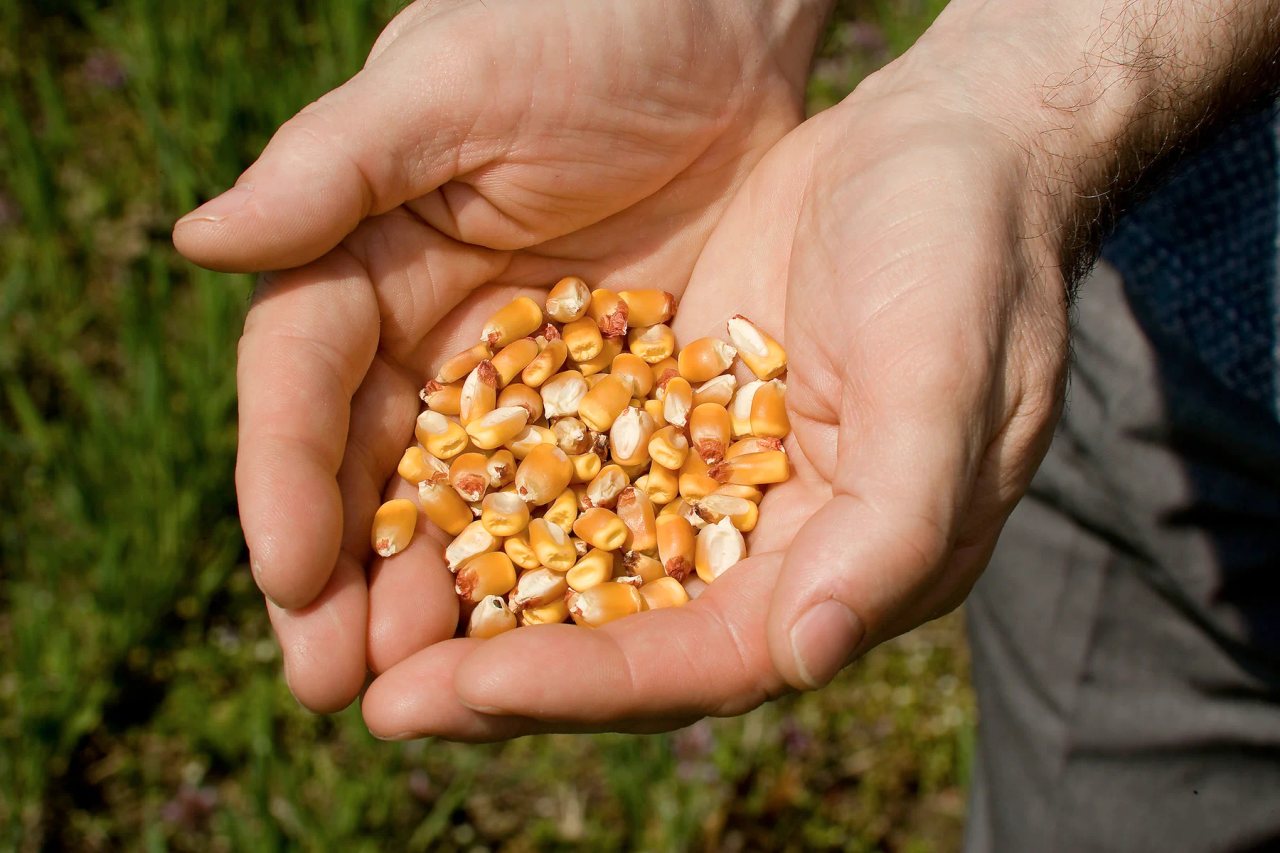
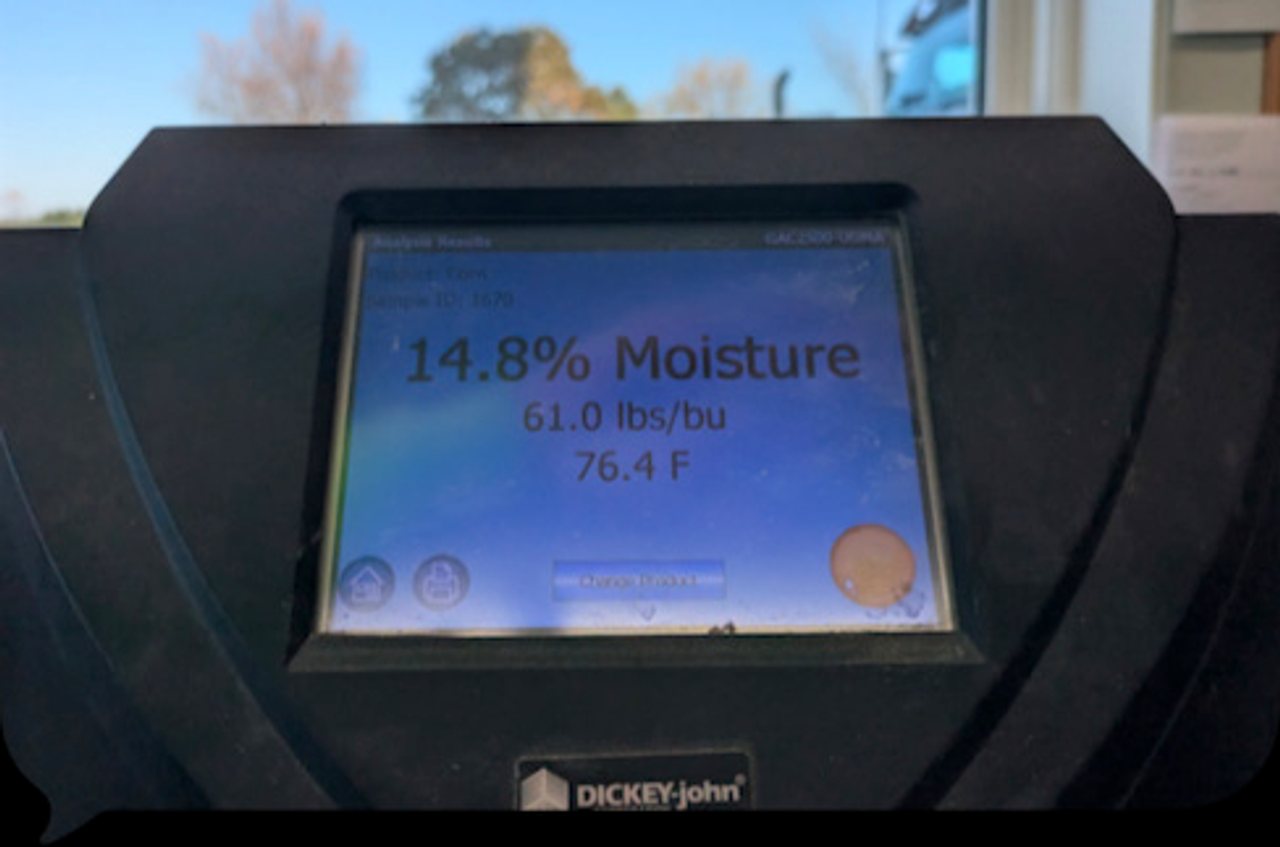
This fall, Joe Ailts sent me a reading from his grain tester. His corn tested at 61.0 pounds per bushel with 14.8% moisture. The reading fit a pattern Joe described in his October 2026 Agronomy Update. Across western Wisconsin, test weights were running high even as yields came in below average. How can a bushel weigh more in a season when the fields produce less grain? [1]
From a bucket to a bushel
Imagine harvesting two strips of corn the same size. The first fills 10 buckets with 10 pounds of grain apiece, for a total of 100 pounds. From the second strip, each bucket holds 11 pounds of corn, but you fill only eight. You carry heavier buckets back from that strip and end up with 88 pounds of grain.
The grain tester works on the same principle as the bucket. A test weight of 61 lb/bu means a standard bushel of volume, about 1.24 cubic feet, holds 61 pounds of that corn. The size, shape, condition and moisture of the kernels affect how tightly they pack. [2][3]
A market bushel is how corn is counted when it’s sold or reported as yield. For shelled corn, that’s 56 pounds. To get the market bushels for a load, start with its scale weight, apply the moisture adjustment under the buyer’s terms and divide by 56. [3][4]
To measure test weight, a USDA grain inspector lets corn flow from a hopper into a calibrated cup called a kettle. Once the cup overflows, the inspector levels the grain at the rim and weighs it. A scale or conversion table gives the result in pounds per bushel. The cup is filled the same way each time because a shake or a tap can change how the kernels settle. [2]
What happened after pollination in Wisconsin
Heading into pollination, Joe thought the crop had the best setup he’d seen in his career. The plants had set their kernel rows with little stress, and pollination went smoothly. “Then the water shut off,” he wrote. [1]
Water stress early in grain fill can cause kernels near the tip of the ear to stop developing. Later in grain fill, stress can limit how much dry matter the surviving kernels put on. Joe suspects some tip kernels were lost and more of the crop’s available starch went to kernels in the middle and at the base of the ear. Fewer kernels can leave less grain to harvest even when the remaining ones fill well. [1][6]
Disease pressure stayed low through grain fill. After black layer, when the kernels had finished filling, warm weather and little rewetting helped the crop dry quickly in the field. Near the junction of Polk, St. Croix, Barron and Dunn counties, Joe reported about 2,500 growing degree units from May 1 to October 1, compared with about 2,200 in an average year. [1]
Joe points to that quick dry-down as a reason for the high test weights. As sound kernels dry, they shrink and can pack more tightly. By Purdue’s estimate, sound corn that tests 52 lb/bu at 25% moisture could reach about 58.9 lb/bu when dried to 15%. Severe stress can leave kernels poorly filled and lower the test weight. [1][3][6]
How test weight and yield compared in Kansas
The two numbers also told different stories in a 2011 Kansas State trial at Scandia, where 60 hybrids grew side by side under irrigation. The corn with the highest test weight, 62 lb/bu, had the lowest yield at 162 bushels per acre. The top-yielding hybrid made 241 bushels per acre and tested at 58 lb/bu. [8]
Twenty-eight of those hybrids also grew at Manhattan, Kansas. Hybrids with higher test weights at one site tended to test higher at the other, while yields lined up less closely between sites. Purdue agronomist Bob Nielsen found a weak relationship between test weight and yield in Kansas and Ohio trials. [3][8]
When choosing hybrids, Joe looks for staygreen, the ability to keep leaves green late in the season. Leaf disease can cut photosynthesis during grain fill and hurt both yield and test weight. [1][3]
What test weight means for bin space and grade
Once the grain is in the bin, packing matters. Joe uses two pails to illustrate the idea. Scale that up to two loads of corn and you can see how a difference in test weight changes what fits in a bin. [1]
Start with two loads that weigh 56,000 pounds each at the buyer’s base moisture. Both contain 1,000 market bushels. The corn that tests at 61 lb/bu takes up about 918 bushels of bin space, while the 56 lb/bu corn takes up 1,000. Now fill a 1,000-bushel bin with each. The 61 lb/bu corn gives you 5,000 more pounds in the same space. [3][4]
At the elevator, test weight is one part of the grade. Corn at 61 lb/bu clears the USDA test-weight minimum for both U.S. No. 1 corn (56 lb/bu) and U.S. No. 2 (54 lb/bu). The grade also depends on factors such as kernel damage, broken corn and foreign material. Your buyer’s contract sets any price adjustment for grade or quality. [3][5]
How weight and moisture shape your scale ticket
The grade can affect the price per bushel. To figure out how many bushels are on the ticket, start with the load’s weight and moisture. Take a 56,000-pound load that comes in at 20% moisture. It contains 44,800 pounds of dry matter. On a 15.5% moisture basis, that works out to about 53,018 pounds, or 947 market bushels. [3][4]
That calculation accounts for the weight of water removed. Purdue’s drying guide reports on-farm handling losses of 0.22% to 1.71%, and the shrink factor in your buyer’s contract may include an allowance for those losses. [4]
Joe’s sample was already drier than the 15.5% basis in that example. At 14.8% moisture, the same amount of dry matter weighs about 0.8% less than it would at 15.5%. That weight difference is equivalent to about eight market bushels per 1,000. Ask your buyer how they handle deliveries below their base moisture. [4]
Check the yield monitor against a scale
A reliable scale also gives you a way to check your yield monitor as grain conditions change. In Joe’s experience, a well-calibrated mass-flow monitor usually handles a test-weight change of about 5 lb/bu. He estimates that a monitor calibrated on corn at 23% moisture and 52 lb/bu could read 10% to 15% low on corn at 16% moisture and 61 lb/bu. That’s why he recalibrates during harvest when moisture and test weight change. [1]
Weigh a calibration load on a reliable grain cart scale, weigh wagon or truck scale and compare it with the monitor reading. Follow the manufacturer’s procedure. If it calls for several loads, run them at different grain flow rates. Check moisture with a separate tester while you’re at it. [7]
Check your own fields
Pick two fields from this harvest and enter the harvested acres, scale weight, moisture and test weight for each. The calculator puts both yields on a 15.5% moisture basis so you can compare them directly.
Did the field with the higher test weight also yield more? If the numbers went in different directions, think back to pollination, grain fill and dry-down. If you have ear samples from the same hybrid, compare the number of kernels per ear and the weight of the kernels at similar moisture. That can help you see where the yield difference came from. I’d like to hear what you saw and which numbers came from the same load.
Another question from Joe led to our look at why a cover crop can hold more potassium than your soil test shows.