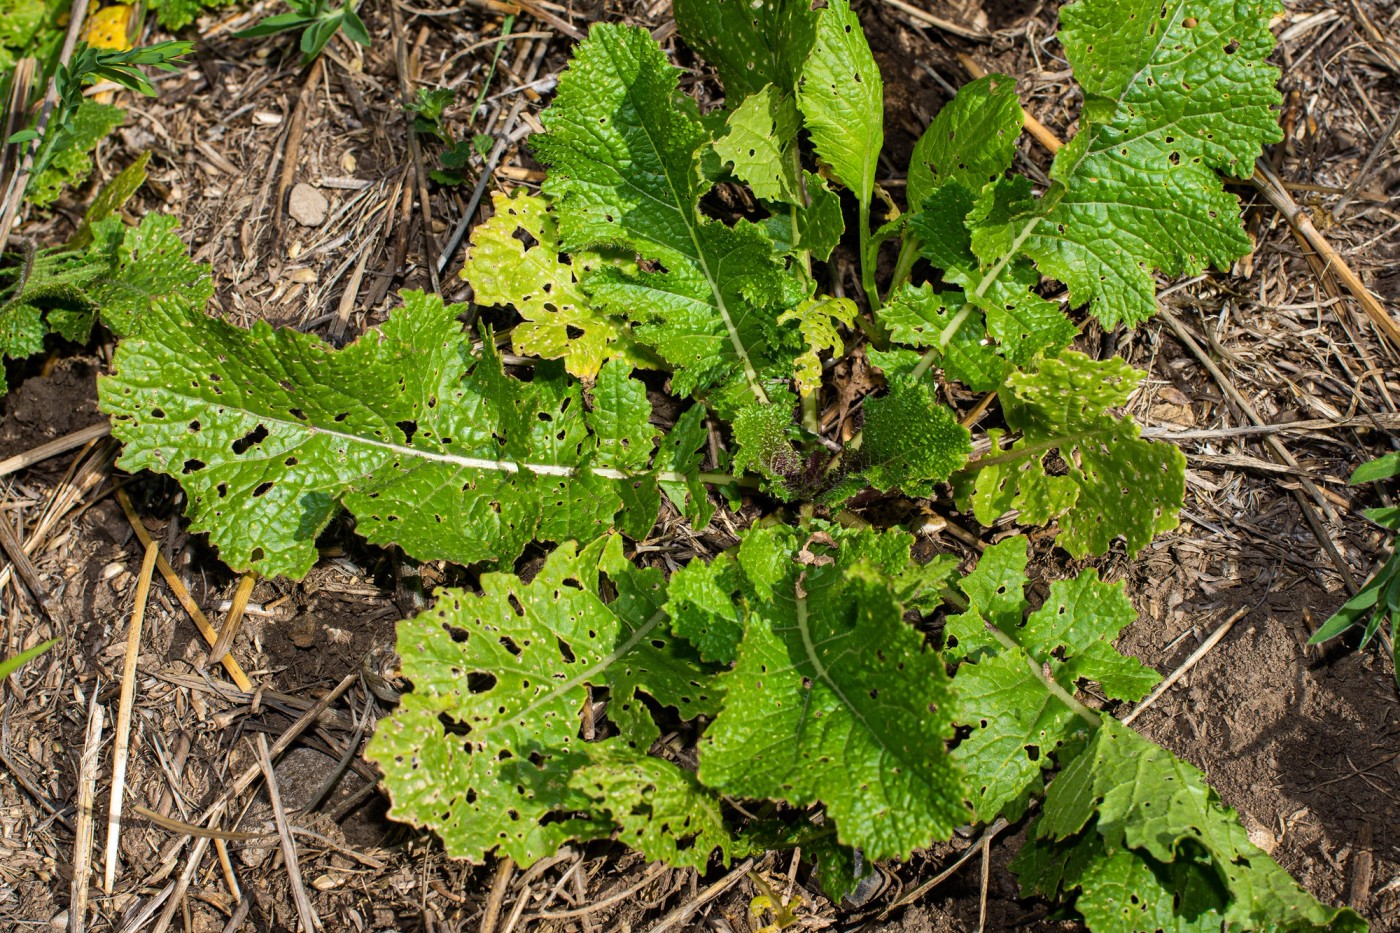
A grower in northwest Wisconsin seeded a fall mix of sunflower, barley, buckwheat, turnip, and medium red clover after sweet corn in the first week of August. By fall, the purple turnips were bigger than softballs, most of each bulb sitting above the soil. A cover crop biomass test put the potassium in the aboveground growth at 291 lb K₂O per acre, the equivalent of about 485 lb of 0-0-60 potash. The field gets no phosphorus or potassium fertilizer; years of turkey litter built its soil test potassium to around 150 lb per acre.
As the grower put it, “How does that math math?” The post set that question aside to discuss brassica root fungi, which we take up in What fungi do brassica roots partner with if not mycorrhizae?
Both numbers can be right, because they count different things. A soil test reads a small, calibrated slice of the field’s potassium. A biomass test counts what the plants pulled from a much larger supply, and most of that potassium returns to the soil within weeks to months.
The short answer
A routine soil test is an index of plant-available potassium in the plow layer, calibrated to predict whether a crop will respond to potash. It is not an inventory: most soil potassium sits in forms the test does not read, and roots also feed below the sampling depth. A biomass test counts the potassium a cover crop took up, nearly all of it recycled from the field. Use the soil test, sampled consistently, for potash decisions. Use the biomass test to see how much potassium is cycling and what would leave if the cover were harvested.
Start with the units
Put both numbers in the same unit first. Fertilizer labels and most biomass reports use K₂O, the oxide form. Soil tests report elemental potassium (K). One pound of K₂O contains 0.83 lb of K, and muriate of potash is 0-0-60 to 0-0-62, about 60% K₂O [1].
Translating the biomass result
| Expressed as | Amount per acre | How it is calculated |
|---|---|---|
| Biomass test, as reported | 291 lb K₂O | Lab value |
| Elemental potassium | about 242 lb K | 291 × 0.83 |
| 0-0-60 potash product | about 485 lb | 291 ÷ 0.60 |
| Same amount written as a 6-inch soil-test value | about 121 ppm K | 242 ÷ 2 |
Conversions from UW guidelines: K₂O × 0.83 = K; ppm in a 6-inch layer × 2 = lb per acre [1].
Then check what the soil number means. Wisconsin-certified labs extract soil potassium with the Bray-1 method and report it in parts per million [1]. A reading described as “150 lb per acre” may be a 75 ppm result converted with the standard ×2 factor, or a 150 ppm result. For sweet corn on a loamy soil, UW rates 75 ppm Very Low and 150 ppm High [1]. Find the units and method on the lab report before interpreting either number.
A soil test is a gauge, not an inventory
A routine soil test estimates the potassium in soil water and on the exchange sites of clay and organic matter, the forms a crop can draw on right away [2]. UW describes phosphorus and potassium tests as indexes of available nutrients. Their value comes from calibration: field trials tie each test range to the chance that a crop will respond to potash. In Wisconsin, a Very Low potassium test carries a better than 90% probability of a yield increase from added potassium, an Optimum test 30–60%, and a High test 5–30% [1]. UW Extension is updating its corn and soybean ranges for 2026, so check the current edition when you read a report [17].
That design explains the gap. Most of a soil’s potassium is invisible to the test. Total potassium in many soils exceeds 20,000 ppm, about 40,000 lb per acre in the top 6 inches by the standard conversion, and 90–98% of it is held in minerals such as feldspars and micas [3][4]. Between those minerals and the exchange sites sits a fixed, slowly available pool that routine tests do not measure. It stays in balance with the exchangeable pool and releases some potassium during the season, though a crop draws little of it in a single year [3].
Where soil potassium sits
| Pool | Share of total soil K | Read by a routine soil test? |
|---|---|---|
| Solution K | A small fraction; 1–3% of exchangeable K | Yes |
| Exchangeable K | 1–2% | Yes |
| Non-exchangeable (fixed) K | 1–2% | No; released slowly, little within one season |
| Mineral K | 90–98% | No; released over decades as minerals weather |
Shares from Montana State University Extension [4]. UW and the University of Minnesota give the same 90–98% mineral share [2][3].
Wisconsin’s own guidelines show how much potassium slips out of the test’s view. Raising soil test potassium by 1 ppm takes about 5 to 7 lb K₂O per acre, depending on soil group [1]. On paper, 1 ppm in a 6-inch layer is only about 2.4 lb K₂O. Much of the rest moves into pools the test does not read.
Roots also feed below the sample. UW calibrations use samples taken to plow depth, at least 6 inches [1]. Across 34 German field trials, soil below 30 cm (12 inches) supplied an average of 34% of the potassium taken up by spring wheat, ranging from 9 to 70%, and the subsoil share was largest where topsoil potassium was lowest [5].
What a biomass test counts
A cover crop biomass test multiplies two measurements: dry matter per acre, from plants clipped inside a frame of known size [6], and the potassium concentration of that tissue, from a lab analysis. The result is the potassium in the sampled growth on the day it was cut.
Fast-growing fall species take up a lot of it. In a Swiss trial of 20 cover crops sown in early August and sampled 85 days later without fertilizer, shoots averaged 3.07% K and held the equivalent of about 192 lb K₂O per acre. Daikon radish shoots held about 285 lb K₂O-equivalent per acre, with about 160 more in the roots. Sunflower shoots held about 277, turnip rape (a leafy Brassica rapa) about 180, and buckwheat about 32 [7].
So 291 lb K₂O is a large result, but it sits within measured values for a vigorous, early-seeded stand. It equals about 242 lb K. By simple arithmetic, a stand of roughly 5,400 to 8,000 lb of dry matter per acre would hold that much at 3–4.5% K. Oat and brassica mixes planted from mid-August to early September in Nebraska produced 2,200 to 4,200 lb of dry matter per acre [8], and forage turnip can yield 3 to 4 tons of dry matter about 90 days after planting [9]. Softball-size turnips point to a heavy stand.
Crops such as alfalfa take up more potassium than they need when supply is high, a pattern called luxury consumption [10]. More broadly, high soil potassium raises potassium in vegetative tissue, so residue on well-supplied ground carries more potassium than average values suggest [11].
Two sampling details move the number. Protocols clip plants at or about an inch above the soil surface [6], which leaves a turnip bulb sitting mostly above ground in an undefined spot; including or excluding bulbs changes the result. Frame size magnifies every plant: in a 2-by-2-foot frame, each extra 0.1 lb of dry matter works out to about 1,089 lb per acre, or about 52 lb K₂O per acre at 4% K. Clip several frames across the field, and record whether bulbs went into the bag.
Where that potassium goes next
Potassium in plant tissue is not built into organic compounds; it stays dissolved in the plant’s water [12]. Once the turnips winter-kill and break down, rain and snowmelt wash it out. In field studies in Brazil and Iowa, up to 50–60% of the potassium in crop and cover crop straw washed out within about six weeks of termination [11]. In a Brazilian study, fodder radish residue released potassium faster than any other nutrient: 95% within 45 days, with release fastest around day 15 [13]. In Iowa, most of the potassium in corn and soybean residue left before December, little more left while the soil was frozen, and by early April the residue still held 31% of corn’s and 12% of soybean’s vegetative potassium [14].
Nearly all of that potassium lands back on the soil surface. Among the nutrients compared in more than 10,000 soil profiles worldwide, phosphorus and potassium were the most concentrated near the surface, which the researchers attribute to plants pulling them up and returning them in litter [15]. A deep-rooted cover crop can lift some potassium from below the sampling depth and from slowly available forms [11]. Unless the cover is hauled off as forage, nearly all of its potassium stays in the field, apart from some leaching on sandy soils [2]; the cover crop moves it.
The soil test picks up part of that return, unevenly. In Iowa, the change in soil test potassium between harvest and early April tracked the potassium lost from crop residue, with wide scatter, and the researchers called early fall a very unstable time to sample [14]. In a Wisconsin study, spring tests ran higher than fall at only one of five sites [11]. Sample at the same time of year, every time [1]. SHE’s fall soil sampling guide covers timing, depth, and consistency.
What leaves the field
A farm’s potassium balance comes down to what comes in (litter and fertilizer) and what leaves (harvested crops, hay, and forage). UW figures sweet corn removal at 6 lb K₂O per ton of fresh harvest [1], so every 5 tons hauled off removes about 30 lb K₂O. Grazing returns most of the potassium in a cover: grazing animals retain less than 15% of the phosphorus and potassium they eat, and most potassium leaves the animal in urine [16]. Chopping and hauling the cover as forage removes the potassium in the harvested growth.
Turkey litter built this field’s reserve. UW book values put turkey litter at 31 lb K₂O per ton, with 80% credited as available in the first year [1]. At book value, matching the 291 lb K₂O in the cover crop would take about 9 tons of litter per acre on a total-K₂O basis. Without new inputs, each harvest draws that reserve down a little. The cover crop does not change the direction; it changes where the potassium sits for a few months.
Use each number for its job
Which number answers which question
| Your question | Use | Why |
|---|---|---|
| Do I need potash for next year’s crop? | Soil test potassium, same season, depth, and method as earlier samples | Calibrated against crop response in field trials [1] |
| Is the field’s potassium trending up or down? | Soil test history plus a simple ledger of inputs and harvest removal | Shows whether the reserve is building or being drawn down |
| How much potassium is cycling through my cover crop? | Biomass test | Measures uptake on the sampling date |
| What leaves if I harvest or graze the cover? | Biomass test, adjusted for the harvested share | Hauled forage removes its potassium; grazing returns most of it [16] |
| Can I credit cover crop potassium against fertilizer? | The next soil test, taken at the usual time | UW gives no potassium credit for any cover crop (it credits nitrogen from legume green manures only); track returned potassium with soil tests taken at the same time each year [1][11] |
Pair each question with the measurement designed to answer it.
Back to the field
The math works. The turnips and their companions pulled close to 300 lb K₂O into their aboveground growth, drawing on exchangeable potassium, the slowly released reserve, and soil below the probe. The soil test gave a calibrated reading of the small pool it was built to measure. Each number is useful when it answers its own question.
For next season, keep four records together:
- The soil report: confirm the units and extraction method, and sample at the same time and depth as before.
- The biomass sample: note the frame size, number of frames, and whether turnip bulbs were included.
- The potassium ledger: litter or fertilizer applied, and crops or forage hauled off.
- The trend: compare each new soil test with the last two or three.
That ledger, more than either single number, tells you whether the field’s potassium bank is holding.
Discussion
No comments yet. Be the first to share your thoughts!