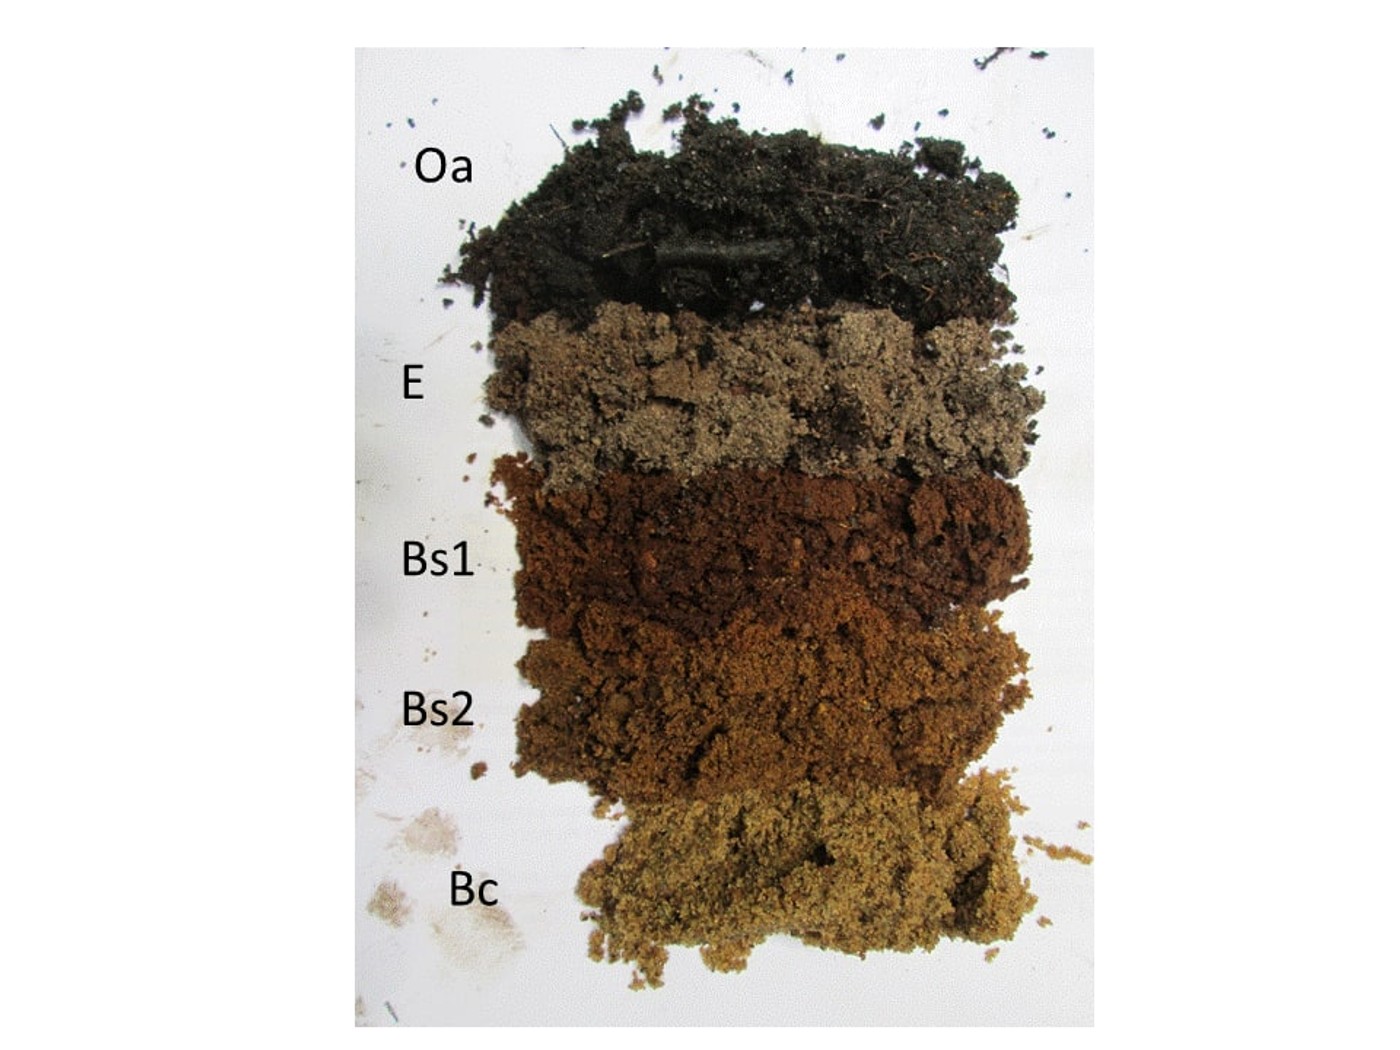
A sandy rise and a heavier part of the field both test at 117 ppm potassium. The sandy rise reports CEC 6 and potassium saturation 5%. The heavier zone reports CEC 24 and potassium saturation 1.25%. If you read the percentages alone, you might spend money on the heavier zone first. These example reports give the same soil-test potassium concentration. The percentage is lower in the heavier zone because the same amount of potassium occupies a smaller share of its exchange capacity. [1]
What the CEC number measures
Clay and organic matter carry negative charges that attract positively charged ions, called cations. These include potassium (K⁺), calcium (Ca²⁺), magnesium (Mg²⁺) and ammonium (NH₄⁺). A potassium ion that leaves an exchange site can enter the soil water, where a root can take it up. Other cations can take its place. Cation exchange capacity, or CEC, is the amount of positive charge the soil can hold on those exchange sites. It describes how much exchangeable charge the soil can retain and draw on as conditions change. [1][2][3]
Look for cmol(+)/kg (centimoles of charge per kilogram) or meq/100 g (milliequivalents per 100 grams). The numerical values are equivalent. A CEC of 6 holds 6 centimoles of positive charge per kilogram under the test conditions. One Ca²⁺ ion contributes twice the positive charge of one K⁺ ion. That’s why the lab converts cations from ppm to charge units before adding them. [1][2]
Clay amount, clay mineral type, organic matter and pH all influence CEC. A sandy area often has less exchange capacity than a nearby clay loam. A reading of 6 can be normal for a sandy soil. A higher number means greater capacity under the same method. To learn how much of a nutrient the soil can supply for a crop, check the nutrient’s soil-test result and regional interpretation. [1][2][3]
Find out how the lab got the number
Three CEC labels you may see on a report
| Report label | What it represents | How to compare it |
|---|---|---|
| CEC at pH 7 or CEC-7 | Capacity measured under standardized conditions, commonly with ammonium acetate buffered at pH 7. | Compare with the same method. On an acidic soil with pH-dependent charge, CEC-7 can exceed exchange capacity at its current pH. |
| Effective CEC or ECEC | An estimate of exchange capacity at or near the soil’s current pH. One common approach sums exchangeable bases and exchangeable aluminum using specified methods. | Compare with the same ECEC procedure, depth and zone. A different test pH can change the charge a lab measures. |
| Estimated or calculated CEC | A lab calculation from extracted cations and, depending on the method, an acidity term. | Ask which extractant, cations and acidity measurement the lab uses. |
Ask the lab for the procedure when the report lists only “CEC.”
Missouri’s routine result, for example, adds extracted Ca, Mg, K and Na in charge units and includes neutralizable acidity. Virginia Tech’s routine calculation uses Mehlich-1-extractable Ca, Mg and K plus acidity estimated from a buffer test. If a new report jumps from 8 to 14 after you switched labs, compare the methods and sampling depth before crediting last year’s management. On a calcareous sample, ask whether the method can pull calcium out of free carbonates as well as exchange sites. [1][2][4]
Read the cation amount and its percentage together
The same soil-test K at two CEC levels
Using Missouri’s potassium conversion, 117 ppm K ÷ 391 ≈ 0.30 cmol(+)/kg. To calculate potassium saturation, divide the K charge by the compatible CEC and multiply by 100. Both results below are illustrative, with the same laboratory method and depth. [1]
Same potassium reading, different percentages
| Lab result | Sandy rise | Heavier zone |
|---|---|---|
| CEC, cmol(+)/kg | 6 | 24 |
| Soil-test K, ppm | 117 | 117 |
| Extracted K charge, cmol(+)/kg | 0.30 | 0.30 |
| Potassium saturation | 5% | 1.25% |
Illustrative results on the same lab basis. Potassium charge and saturation are rounded.
The potassium percentage tells you its share of the measured exchange capacity. Calcium and magnesium percentages use the same idea. Total base saturation is the combined share for Ca, Mg, K and Na when those are the bases in the method. Some reports also show an acidity or H line. Ask how the lab calculated that line before comparing it with another report. For fertilizer, use the lab’s crop-calibrated nutrient rating and recommendation. Experiments reviewed by Iowa State support supplying enough of each nutrient without paying to hit an ideal Ca:Mg ratio. [1][2][5]
Put CEC to work in the field
On the sandy rise, watch the potassium trend. Sample it separately if you can manage it separately. Use a consistent method, depth and season. On lower-CEC soils, a large removal of K in hay or silage can draw down a smaller reserve faster. If the local lab rates the zone low, use its crop recommendation and discuss placement and timing. A split can be worth testing in some systems. Minnesota corn trials on sandy soils found a single preplant K application sufficient compared with a preplant-plus-in-season split, so make the extra trip earn its place. [1][6][7]
In the heavier zone, ask what the crop is likely to respond to. If the regional soil-test interpretation says K is adequate despite the lower K saturation, avoid buying potash to raise the percentage. Use the local maintenance guidance and track crop removal. If symptoms occur where the test is adequate, compare an affected spot with a nearby healthy one and check rooting, moisture and compaction. Ask your adviser whether a paired soil and tissue test would help. [1][6]
If the lab calls for 60 lb K₂O per acre after you account for nutrient credits as directed, a 0-0-60 product supplies 60% K₂O by weight. That works out to 100 lb of product per acre. This is an example of converting a recommendation from the lab, which comes from the crop and its soil-test rating. [1]
For lime, start with pH and the crop target. CEC helps explain why soils respond differently. Use the lab’s lime recommendation to set the rate. The soil pH and buffer pH guide walks through that decision and shows how to convert the rate into tons of the product you’ll spread. [8]
For nitrogen, account for loss risk. CEC can retain ammonium because it carries a positive charge. Nitrate carries a negative charge and can move with drainage water even when CEC is high. Base nitrogen rate and timing on the local crop guidance, available credits, and loss risk. [3][10]
Investigate the combination of high sodium and poor infiltration. If the report shows elevated sodium saturation and the zone seals, crusts or ponds, ask the lab for salinity and sodicity tests. Electrical conductivity (EC) helps assess soluble salts. Sodium adsorption ratio (SAR) or exchangeable sodium percentage (ESP) helps assess sodium risk. In irrigated fields, check the water too. Use the diagnosis and drainage conditions to decide whether an amendment such as gypsum is appropriate. [1][9][11]
Build organic matter with practices that suit the field, such as keeping residue, diversifying a rotation, or using cover crops. Track the soil and crop outcomes you want, such as steadier test K or better residue cover. A change in lab method or soil pH can move the CEC reading too. [1][2][3]
Keep CEC beside the map of your fields. Circle the zone where capacity, harvest removal and soil-test trends point to a different management decision. On the next sampling trip, take separate composites and record the same depth for each zone. Put the lab’s interpretation beside last season’s fertilizer and harvest records. That comparison gives you a place to act and a way to check what happened. Ask a field question if you have two reports you’re trying to compare.

Discussion
No comments yet. Be the first to share your thoughts!