How to Read a Corn Nitrogen Recommendation: Rate, Credits, Economics, and Uncertainty
A practical guide to understanding a corn nitrogen recommendation, checking its economics, accounting for manure and other credits once, and deciding what needs local confirmation before application.
SH
By Soil Health Exchange Team||20 min read|18 reads
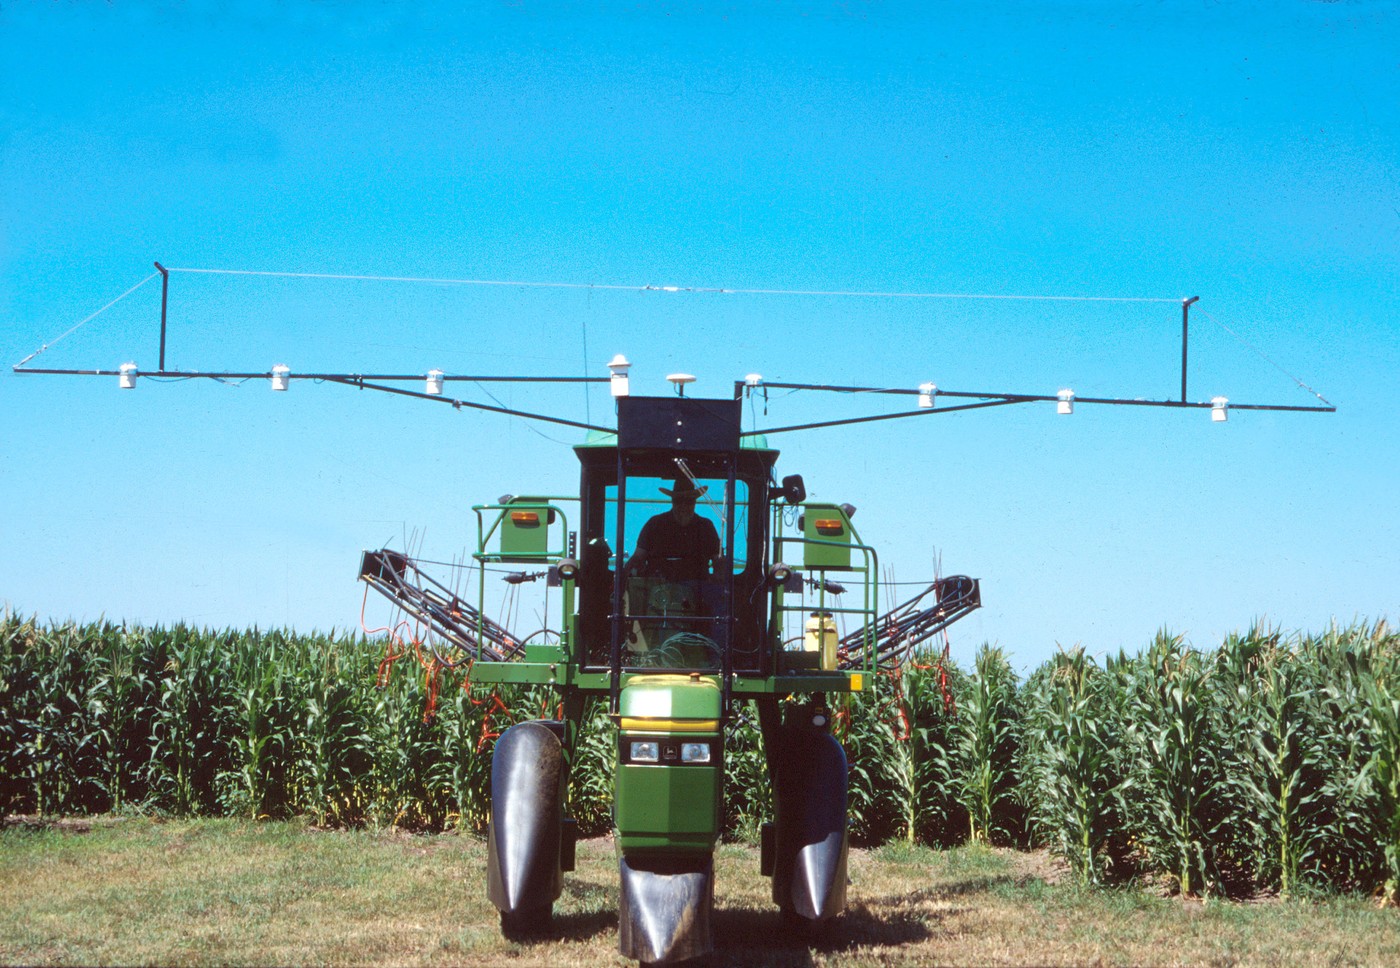
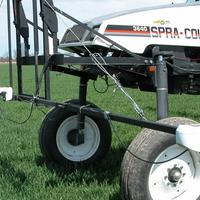
A corn nitrogen recommendation becomes more useful as field and crop information becomes more specific. On this USDA-ARS applicator, canopy sensors monitor plant greenness and send a signal that adjusts the nitrogen application rate. — Credit: Photo by James Schepers, USDA Agricultural Research Service · Image K8696-19
Start with the current land-grant recommendation system for the field's location, rotation, soil, and production setting. Write down what its number represents, update the corn and fertilizer prices it requires, and build one nitrogen ledger for starter, manure, previous crops, soil nitrate, irrigation water, cover crops, and other recognized sources. Check which credits are already built into the recommendation before subtracting anything. Use nitrate and soil-health tests only for decisions supported by their sampling protocol and local calibration. Then plan source, timing, placement, and loss protection around the field and the farm's application capacity. No tool can know the exact economic optimum before the season, but a traceable recommendation and a useful profitable range can still support a sound decision.
A corn nitrogen recommendation often arrives as one number, but that number can hide several decisions. Does it already account for corn following soybean? Has manure been credited? Which corn and fertilizer prices were used? Is the result a full-season rate or only the remaining sidedress amount? Before changing the rate, begin by finding out what the number already includes.
How to use this guide
Use this guide to check what a corn nitrogen recommendation means, which inputs and credits it uses, and what still needs to be decided. Set the field rate with the current land-grant method for the field, any applicable nutrient-management requirements, and local professional guidance. The examples explain the process; they are not rates to copy into another state or production system.
Start by asking what the number means
Corn takes up nitrogen from several sources: mineral nitrogen already in the root zone, nitrogen released from soil organic matter and crop residues, manure and other organic amendments, irrigation water, and fertilizer. A recommendation system estimates the fertilizer needed after accounting for the other sources recognized by that method [1]. That amount is not the same as total crop nitrogen uptake. A report may show total fertilizer N, total plant-available N from fertilizer plus manure, a base guideline before credits, or only the remaining sidedress amount. Start with one question: "What does this number represent?"
The exact field-season requirement is unknown before planting. Temperature, rainfall amount and timing, soil drainage and texture, mineralization, rooting, previous management, fertilizer source, placement, and loss processes interact throughout the season. The economically optimum nitrogen rate can differ among fields, within a field, and from one year to the next in the same field [1][11][12]. A recommendation is a calibrated forecast made before all of that information exists.
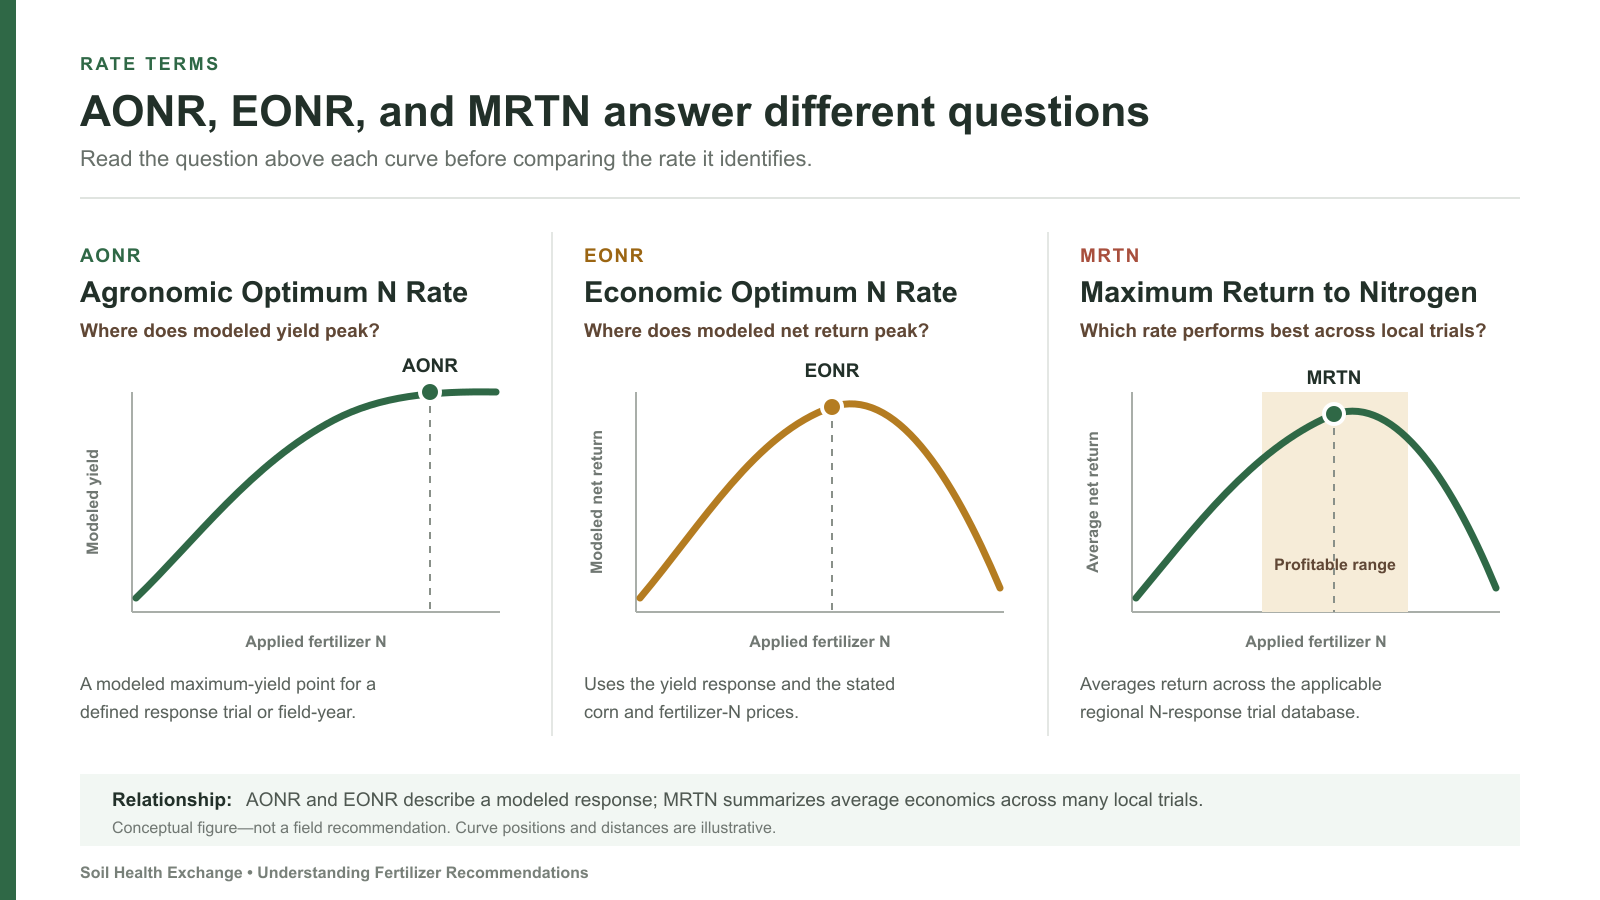
Even after harvest, the optimum still has to be estimated. Researchers apply several N rates, measure yield response, fit a response curve, and—when economics are included—find the point where the expected value of the last yield increment no longer pays for the last increment of N. The chosen response model matters: in a classic 12-site-year comparison, several models fit yield data similarly but produced markedly different calculated economic optima [4]. That is one reason to treat the optimum as an estimate rather than a number known with certainty.
Terms used throughout this guide
Term
Working meaning
Interpretation note
Crop N uptake
Nitrogen contained in the crop by a defined stage or at harvest
The amount of fertilizer N that must be applied
Agronomic optimum N rate (AONR)
Rate associated with the modeled maximum yield response
The most profitable rate at current prices
Economic optimum N rate (EONR)
Modeled rate where the marginal value of added yield equals the marginal N cost
A number known exactly before the season
Maximum Return to Nitrogen (MRTN)
A regional economic framework that combines results from many local N-response trials with corn and fertilizer-N prices
It reports the rate with the highest average modeled return and a range of rates with nearly equivalent return for the selected region and rotation
Pre-Sidedress Soil Nitrate Test (PSNT)
An in-season soil nitrate test collected before the main sidedress decision at a specified corn stage and sample depth
Its critical value or equation applies only where local research supports that sampling and interpretation protocol
Base guideline
Starting rate or range from an applicable recommendation system
Always the final amount to apply after credits
Final fertilizer or sidedress recommendation
Remaining fertilizer N after the system's applicable adjustments
A universal rate transferable to another state or production system
These terms describe different parts of a nitrogen decision. Sources: Morris et al. [1], Sawyer et al. [3], and current Minnesota guidance [5].
Click to expand
AONR marks the modeled maximum-yield point; EONR adds corn and fertilizer-N prices to the response curve; MRTN finds the highest average return across an applicable regional trial database and reports a near-equivalent profitable range. Curves are conceptual and not to scale [1][3][4]. — Photo: Soil Health Exchange instructional figure
Step 1: start with the recommendation system for your field
A laboratory result can guide a fertilizer rate only after researchers connect the measurement with crop response and calibrate that relationship under defined soils, climates, crops, and management. That is why an equation, soil-test cutoff, or credit should stay within the region and production conditions where it was developed [9].
There is no single U.S. corn nitrogen equation. Several Corn Belt states use the Maximum Return to Nitrogen (MRTN) framework for defined rotations and regions. Nebraska uses a state equation and digital tool that explicitly includes expected yield, residual nitrate, organic matter, other N credits, irrigation, timing, and economics. Pennsylvania has a recalibrated Pre-Sidedress Soil Nitrate Test (PSNT) for a narrower set of no-till, manure-history conditions [3][5][6][7]. Each approach asks for different inputs and applies within different boundaries.
Three official approaches and how their scopes differ
Example
Core approach
Important inputs or boundaries
Important scope note
MRTN in a covered Corn Belt region
Average net return across a database of local N-response trials
State or subregion, rotation, fertilizer-N price, corn price, and covered production setting
Use the result as a regional economic estimate; the rotation effect is already represented by the selected trial group
Keep the equation and its organic-matter and nitrate coefficients within the conditions covered by Nebraska guidance
Pennsylvania PSNT
In-season nitrate-based sidedress calibration
Specified sampling stage and depth, limited preplant fertilizer, long-term manure history, no-till calibration, and stated cover-crop boundaries
Use the equation, sampling protocol, and critical values only within the conditions covered by the Pennsylvania calibration
Examples are abbreviated to show scope. Always use the current official document or calculator. Sources: regional MRTN publication [3], Minnesota corn guidance [5], Nebraska EC117 [6], and Penn State PSNT guidance [7].
For NRCS planning, begin with the current state standard
NRCS Conservation Practice Standard 590 provides the national nutrient-management framework, including accounting for measurable nutrient sources and managing rate, source, placement, and timing. For field planning, NRCS directs users to the current state Field Office Technical Guide and applicable state requirements [10]. A conservation contract, manure plan, permit, or watershed rule may also shape the allowable rate independently of the economic optimum.
Step 2: check the economic target
Maximum yield and maximum profit are not the same target. An economic recommendation compares the cost of an additional pound of N with the value of the additional grain that pound is expected to produce. In an MRTN system, the user supplies the fertilizer-N price and expected corn price; response functions from many local trials are used to calculate return to N across rates. The rate with the highest average return is the MRTN, and the calculator also reports a range with nearly equivalent expected return [1][3].
The economic input is usually expressed as the price of one pound of actual N divided by the price of one bushel of corn. For example, $0.55 per pound of N divided by $5.00 per bushel is a ratio of 0.11. This example only shows the unit conversion; it is not a current market assumption or a rate recommendation. Confirm whether application, handling, or service costs belong in the price used by the selected official tool. Recalculate when prices change rather than carrying last year's economic result into a new season.
A range can be more useful than a single number. The MRTN framework's default profitable range contains rates whose modeled return is within $1 per acre of the maximum across the selected trial database [1][3]. This helps explain an important result from a 49-site-year, eight-state comparison: recommendation tools were generally weak at predicting each site's exact EONR, yet most produced economic returns similar to the hindsight optimum [2]. Several nearby rates may therefore produce nearly the same modeled return.
How to use a profitable range
When an official tool returns a range, keep the range with the recommendation and record the economic assumptions, production setting, and calculation date. Rates within that range have nearly equivalent modeled returns under the stated assumptions. The choice within it can reflect the farm's management capacity, risk preference, and field context; the range also communicates the uncertainty that remains before the season unfolds.
Step 3: count nitrogen already supplied—once
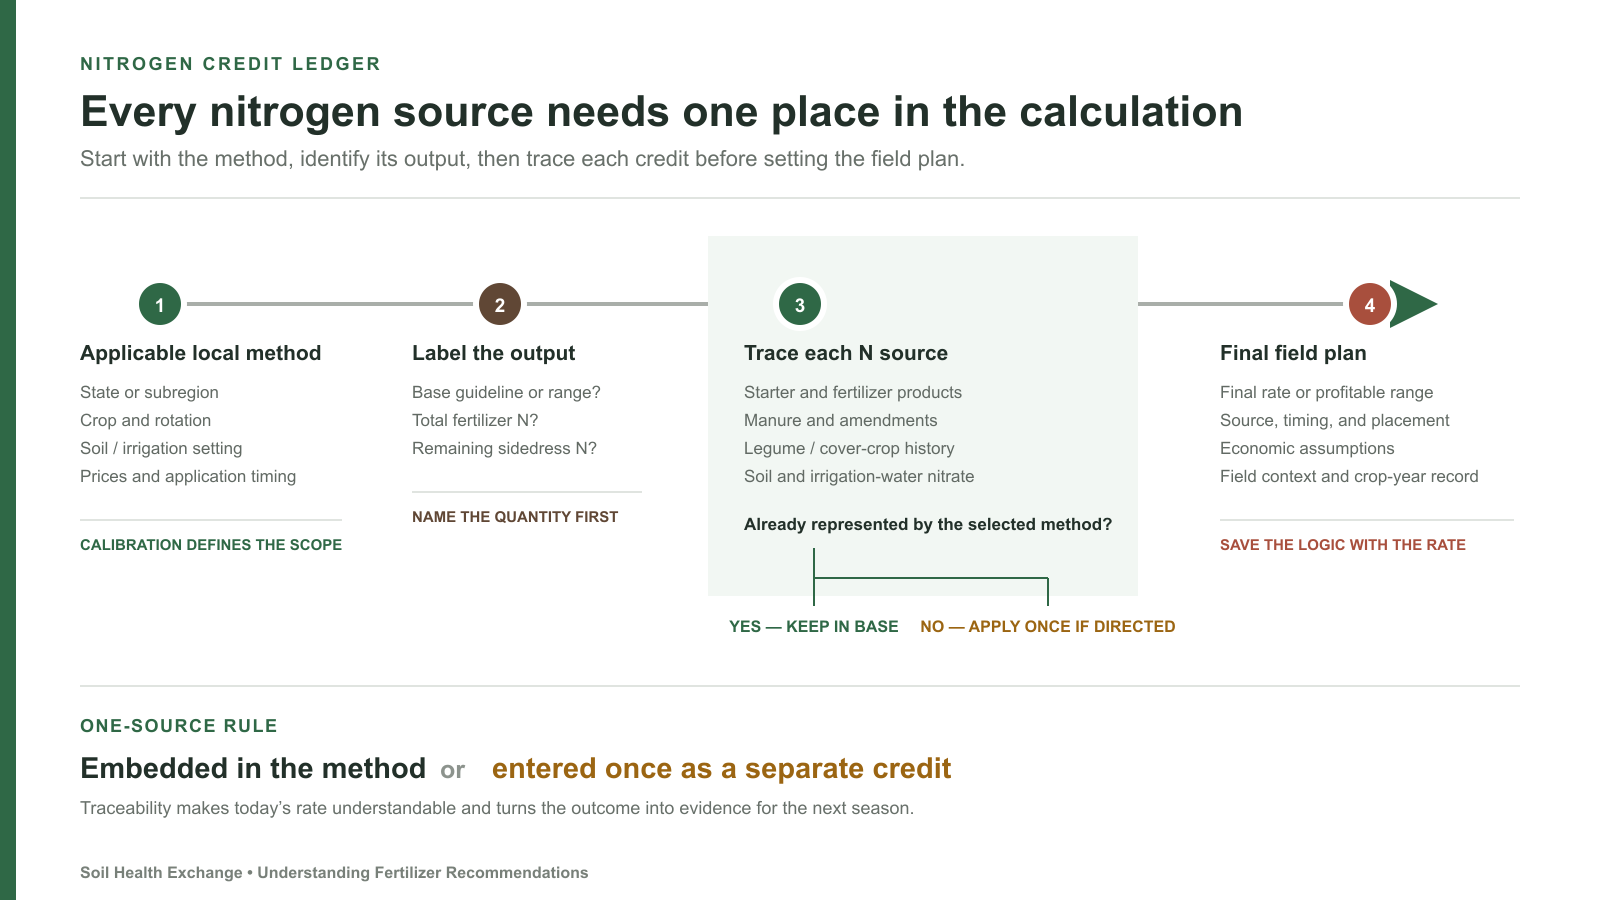
List the nitrogen sources that are already present or planned. These may include starter or carrier fertilizer, N in DAP or MAP, manure and organic amendments, previous legumes, mineral nitrate in the root zone where a calibrated test applies, nitrate in irrigation water, and other sources recognized by the local method [5][6][10]. Then check which sources the recommendation already includes before making another adjustment.
Click to expand
First identify what the recommendation returns, then record every N source and determine whether it is already embedded or should be applied as a separate adjustment. Each source enters once [1][3][5][6][10]. — Photo: Soil Health Exchange instructional figure
Label the output: base guideline, total fertilizer N, total plant-available N, or remaining sidedress N.
List every N-containing material already applied or planned, including starter and N carried in phosphorus products.
Use a current manure analysis when available and the applicable local availability factors for material, timing, placement, and incorporation.
Apply previous-crop and cover-crop credits only as the selected recommendation system directs.
Use residual soil nitrate or irrigation-water nitrate only with the depth, timing, rooting, and conversion rules of the applicable calibration.
Document which credits were embedded in the base rate and which were subtracted afterward.
Previous-crop handling shows why it helps to trace each credit. A rotation-specific MRTN database already separates corn following soybean from continuous corn, so the selected trial group already represents the rotation effect. A different state equation may begin with a more general yield-based term and then explicitly subtract a legume credit. Soil organic matter is handled differently as well: Nebraska's state equation contains an organic-matter term capped to the range represented in its research database, while an MRTN recommendation may capture average soil N supply indirectly through its local response trials rather than printing a separate organic-matter credit [3][6]. No single national conversion assigns the same fertilizer credit to every 1% of soil organic matter.
Manure and cover crops add another layer. Manure contains ammonium and organic N fractions with different availability and loss pathways; availability depends on analysis, material, application timing, placement, incorporation, and weather. Cover crops can capture nitrate, contribute N, or temporarily immobilize it depending on species, biomass, maturity, carbon-to-nitrogen ratio, and termination. Penn State's soil-organic-matter and cover-crop recommendation framework is explicitly described as still under development, which makes it useful evidence of how a local system can be improved—but not a formula to export nationally [17].
Keep every nitrogen credit traceable
Before subtracting soybean, alfalfa, manure, soil nitrate, soil organic matter, cover-crop, or irrigation-water N, check the official documentation for the selected recommendation to see whether that source is already represented. Recording each credit and where it entered the calculation keeps the final rate transparent and prevents the same nitrogen source from being counted twice.
Step 4: use each test only for the decision it can support
Nitrogen tests and tools by decision timing
Tool
Decision timing
What it can contribute
Critical boundary
Preplant or residual soil nitrate test
Before planting or fertilization
Credit nitrate remaining in the sampled root zone
Useful regions, depths, seasons, and conversions differ; drought, rainfall, texture, manure, and rooting depth affect applicability
PSNT or late-spring nitrate test
Before sidedress at a defined corn stage
Measure current nitrate after some early-season mineralization and loss have occurred
Follow the local sampling and prior-N restrictions; equations and critical values are not national
Canopy reflectance or chlorophyll sensing
In season
Detect crop N status relative to a reference and support a locally validated sidedress algorithm
Hybrid, growth stage, sensor, reference strip, water or sulfur stress, and algorithm affect interpretation
PMN, ACE protein, respiration, WEON, or composite soil-health score
Benchmarking or trend monitoring
Characterize biological activity or an organic-N pool under a defined method
A fertilizer-N conversion requires an applicable field-rate calibration
Late-season cornstalk nitrate test
Near or after physiological maturity
Retrospective feedback on likely deficient, adequate, or excessive N supply
Best used as retrospective feedback alongside management and weather records
Applicability is regional and protocol-specific. This table classifies the decision, not a universal interpretation. Sources: Morris et al. [1], Ransom et al. [2], Minnesota guidance [5], Nebraska EC117 [6], Penn State PSNT [7], Clark et al. [8], University of Minnesota soil-health guidance [9], and Penn State cornstalk guidance [15].
Click to expand
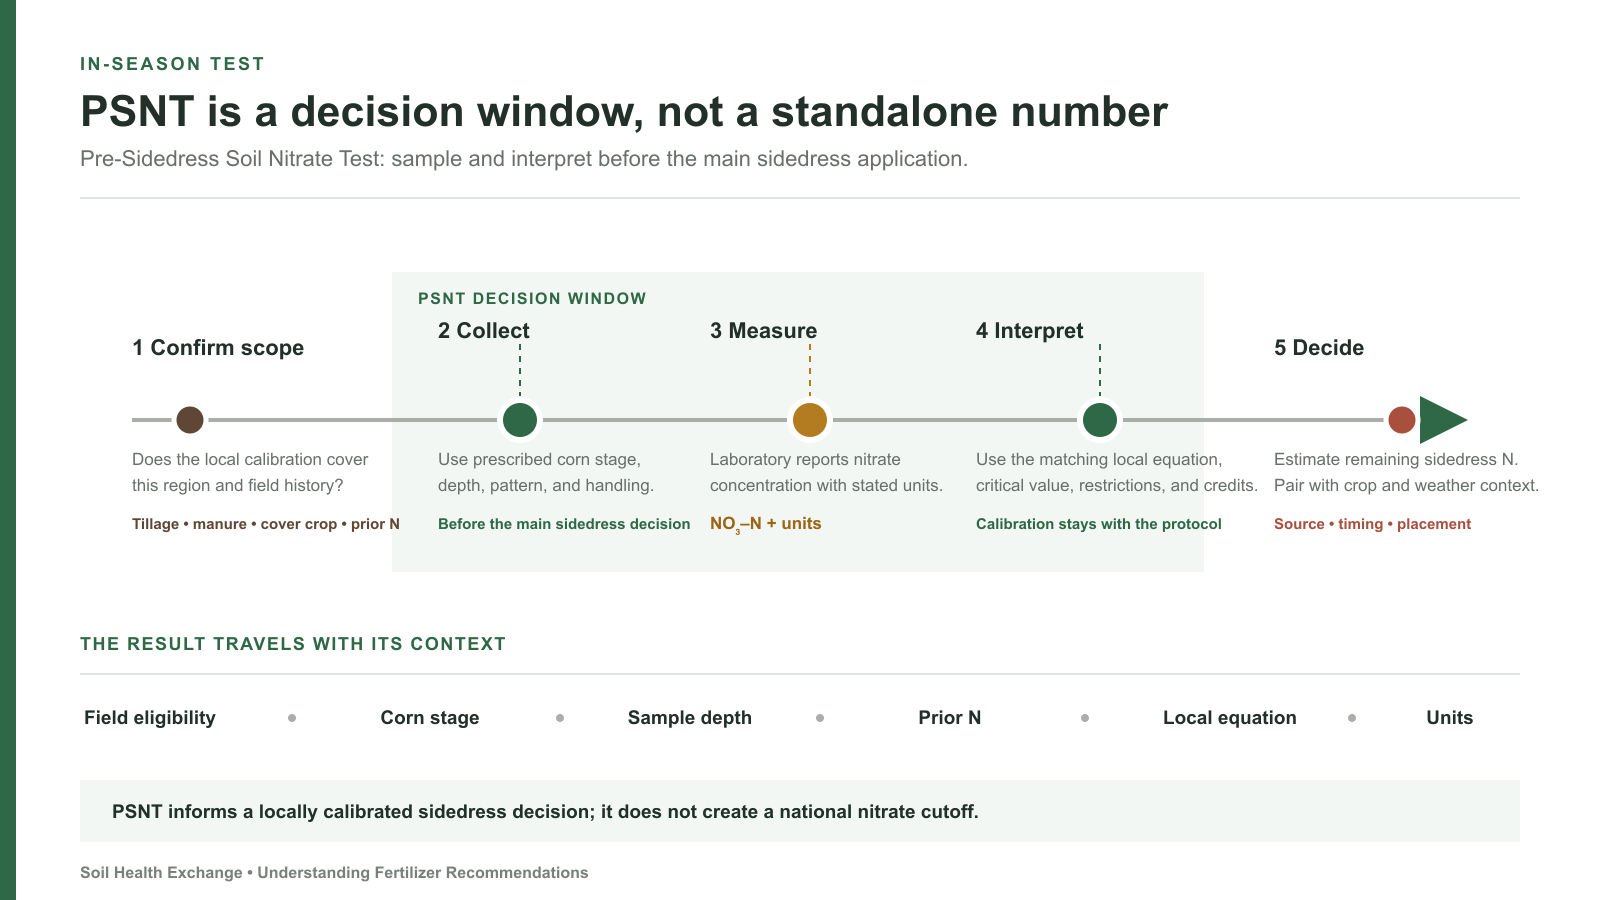
PSNT means Pre-Sidedress Soil Nitrate Test. It informs an in-season sidedress decision only when field eligibility, sampling stage and depth, prior-N restrictions, units, and interpretation all match the local calibration [1][7]. — Photo: Soil Health Exchange instructional figure
A soil nitrate result needs its sampling context. Minnesota recommends deep preplant nitrate testing in defined regions and circumstances, with stated sample depths and field-history rules. Nebraska encourages residual nitrate crediting and describes a two- to four-foot root-zone approach in its state equation. Pennsylvania's current PSNT collects an in-season sample and applies a recalibrated sidedress equation under its documented field-history and management conditions [5][6][7]. The depth, date, field history, and local calibration determine how the concentration can be used.
Soil-health nitrogen measurements answer a different question. PMN estimates mineralizable-N capacity under a fixed laboratory incubation; ACE protein and WEON measure operationally defined organic pools; respiration measures a carbon-mineralization response. In the 49-site-year Midwest dataset, adding PMN and related field information to preplant or pre-sidedress nitrate models improved prediction only marginally, and the authors did not recommend PMN for improving fertilizer management across that dataset [8]. University of Minnesota likewise advises against using nonstandard soil-health procedures to determine fertilizer rates without local correlation and calibration [9]. A useful indicator can still be a poor fertilizer-rate converter.
Step 5: plan how the nitrogen will reach the crop
The rate is only part of the plan. Urea left on the surface, injected manure, anhydrous ammonia, starter fertilizer, fertigation, and sidedressed UAN do not share the same timing, placement, transformation, or loss exposure. First confirm that the rate method applies. Then ask whether the source, timing, placement, soil, drainage, weather exposure, and available equipment can deliver that N when the crop can use it [1][5][10].
Splitting applications can reduce the amount exposed before rapid crop uptake and leave part of the decision until more of the season is known, but it is not automatically better in every field-year. Across the multi-state Midwest trials, weather distribution and soil properties influenced whether split application improved yield or N recovery [13]. The tradeoff is another operation: the farm needs application capacity, crop access, suitable weather, and a backup plan if the pass is delayed or prevented.
Economic optimum also does not encode every environmental consequence of timing. A recent 49-site Midwest analysis evaluated residual soil N alongside EONR and found more residual soil N after split application than after a single at-plant application at EONR in that dataset, even though crop N uptake at EONR did not differ between timings [19]. The result is specific to those sites, treatments, and residual-N measure; it does not prove that one timing is universally preferable. It shows why rate, timing, crop recovery, residual N, and loss risk should be evaluated as related but separate outcomes.
After heavy rain, reassess with local diagnostics
Waterlogging duration, temperature, soil texture, drainage, N form, application date, placement, inhibitors, crop stage, and subsequent weather all affect loss. Current regional guidance, crop and root-zone observations, and a local adviser can help determine whether rescue N is appropriate. Pennsylvania guidance, for example, routes sidedress decisions through defined PSNT and crop-diagnostic tools because rainfall total alone cannot show how many pounds remain [16].
Nine questions to ask before using the recommendation
Authority: Which university, agency, regulation, contract, or adviser produced the method, and is the version current?
Scope: Does it cover this state or subregion, crop, previous crop, irrigation status, soil setting, and application timing?
Output: Is the number a base rate, total fertilizer N, total plant-available N, or remaining sidedress N?
Economics: Which fertilizer-N and corn prices were used, and were the units and relevant application costs handled as the official tool specifies?
Existing N: Which starter, fertilizer products, manure, amendments, legumes, residual nitrate, and irrigation-water sources are already included?
Credits: Which credits are embedded in the base method, and which must still be applied?
Testing: Were sample depth, timing, handling, prior-N restrictions, units, and local calibration correct for the selected test?
Delivery: Do source, timing, placement, drainage, rooting, and operational capacity support the assumed availability?
Verification: What check strip, in-season diagnostic, cornstalk test, yield record, or repeated observation will test the decision?
Minimum record to keep with a nitrogen decision
Record
What to save
Why it matters
Method identity
Source, state or region, tool/document version, calculation date
Recommendations change and older formulas can persist in spreadsheets
Field context
Field or zone, crop, previous crop, soil, irrigation, manure and cover-crop history
Defines whether the calibration applies
Economics
N source, cost per pound actual N, corn price, application-cost treatment
Allows the economic target to be reconstructed
Tests
Coordinates or zone, depth, date, method, units, laboratory, and result
Prevents incompatible nitrate or soil-health results from being substituted
N ledger
Every source, amount, analysis, timing, placement, availability factor, and credit
Exposes omitted or duplicate nitrogen
Outcome
Weather, crop observations, yield, late-season feedback, and trial results
Turns one recommendation into evidence for the next decision
Save the assumptions with the recommendation so the decision can be reconstructed later. Keep this record with the field and crop year.
Use the season to improve the next recommendation
The late-season cornstalk nitrate test is valuable because it asks a question most preseason tools cannot answer: looking backward, was crop N supply more consistent with deficiency, adequacy, or excess? The original test was developed to detect excess N near maturity, and later state guidance pairs the result with rate, manure, crop, weather, and management records [14][15]. It is feedback, not a diagnosis by itself. Drought, restricted roots, pests, compaction, low pH, or lower-than-expected yield can leave nitrate in the stalk even when the initial rate logic seemed reasonable.
Replicated N-rate strips or well-designed check strips can make the field part of the evidence base. The strongest design compares multiple rates, repeats treatments across representative field positions, records all other management, and evaluates net return rather than yield alone. One strip in one season adds a useful local observation; repeated trials can show whether a farm consistently performs near one part of the locally profitable range. The major review of corn N recommendation systems identifies this continuous, systematic feedback as the path toward more useful adaptive recommendations [1].
What the large tool comparison tells us
The eight-state evaluation of 31 public recommendation tools helps set realistic expectations for what these tools can do. Only 10 tools—mostly nitrate-test approaches—showed a statistically detectable but weak relationship with measured EONR, with coefficients of determination no greater than 0.20. No tool was consistently reliable across all 49 site-years [2]. Yet most tools produced economic returns similar to EONR, while yield-goal approaches had the highest environmental costs in that analysis [2].
Those findings mean three things. First, exact field-year prediction remains difficult. Second, a locally supported tool can still be economically useful because returns may be similar across a range near the optimum. Third, tools should be judged by more than closeness to one hindsight rate: profitability, under- and over-application risk, residual N, practicality, data requirements, and the ability to learn from the result all matter. Newer tools that incorporate weather, soil, remote sensing, or management may improve decisions, but they still require independent validation in the conditions where they will be used [2][12][18].
A final check before setting the rate
The fertilizer rate comes from an applicable local calibration rather than crop removal or a pounds-per-bushel rule alone.
Crop N uptake, AONR, EONR, MRTN, and the final fertilizer rate are labeled as distinct quantities.
The selected recommendation covers the field's state or region and production setting.
Fertilizer and corn prices use the units required by the official tool, including its treatment of application costs.
Each soybean, organic-matter, manure, nitrate, cover-crop, or irrigation-water credit is entered once.
The nitrate sample depth, timing, field history, and interpretation match the selected local calibration.
PMN, ACE protein, respiration, WEON, or a soil-health score is used as a fertilizer credit only when supported by an applicable field-rate calibration.
Any rate adjustment associated with split application, an inhibitor, or a sensor follows locally validated guidance.
The economic optimum is considered separately from regulatory limits and environmental-loss risk.
Changes to the farm program draw on replicated or repeated evidence across representative conditions.
What a useful recommendation includes
Look for a locally calibrated starting point, current economics, a complete N ledger with no duplicated credits, tests used within their valid scope, a delivery plan suited to the field, and a record that lets the farm learn from the outcome.
Where to take the field decision next
Begin with the current land-grant nutrient-management guidance for the state where the field is located. Confirm the crop, rotation, irrigation status, soil and drainage setting, organic nutrient history, and whether a conservation contract or regulated nutrient-management plan applies. Use the official calculator or worksheet linked by that guidance, preserve its rate or profitable range, and document every subsequent credit. If the field does not match the calibration—or if manure, cover crops, irrigation, unusual weather, or rescue N create ambiguity—take the record to a qualified local agronomist rather than filling the gap with a national rule.
The goal is a recommendation you can trace: where it came from, what it includes, which economics and credits shaped it, how the N will be delivered, and what you will record afterward. That makes the decision easier to review this season and improve in the next one.
Corn Nitrogen Recommendation Knowledge Check
Each attempt draws 8 questions from a 21-question pool and shuffles the questions and answer choices. Score 85% or higher to earn a Certificate of Completion.
1.What is a corn fertilizer-N recommendation primarily trying to estimate?
2.How does the economic optimum N rate (EONR) differ from the agronomic optimum N rate (AONR)?
3.Why should a recommendation equation or nitrate threshold not be moved casually from one state to another?
4.What should be established before adding or subtracting any nitrogen credit?
5.Which inputs are central to a Maximum Return to Nitrogen calculation?
6.What does an MRTN profitable range communicate?
7.A rotation-specific MRTN result is already for corn following soybean. What is the main risk of subtracting an additional soybean credit?
8.Which statement about soil organic matter credits is most defensible?
Soil Health Exchange Team (2026). How to Read a Corn Nitrogen Recommendation: Rate, Credits, Economics, and Uncertainty. Soil Health Exchange. https://soilhealthexchange.com/blog/corn-nitrogen-recommendation-rate-credits-economics
More citation formats
MLA
Soil Health Exchange Team. "How to Read a Corn Nitrogen Recommendation: Rate, Credits, Economics, and Uncertainty." Soil Health Exchange, 2026-08-28, https://soilhealthexchange.com/blog/corn-nitrogen-recommendation-rate-credits-economics.
Chicago
Soil Health Exchange Team. "How to Read a Corn Nitrogen Recommendation: Rate, Credits, Economics, and Uncertainty." Soil Health Exchange. Published 2026-08-28. https://soilhealthexchange.com/blog/corn-nitrogen-recommendation-rate-credits-economics.



Discussion
No comments yet. Be the first to share your thoughts!