Part 1 · Understanding & Interpreting Soil Health Indicators
Research Brief
PLFA Analysis: What Soil Biology Testing Can and Cannot Tell You
PLFA is the most reproducible method for measuring living microbial biomass in soil — but no validated thresholds exist for interpreting the numbers. Here is what the science actually supports.

Phospholipid fatty acid analysis is the most reproducible, quantitative method available for simultaneously measuring living microbial biomass and community structure in soil — yet it remains one of the least actionable tools in the agronomist’s toolkit. PLFA can detect shifts in fungal abundance, bacterial stress, and mycorrhizal networks that no chemical soil test captures, and meta-analyses consistently show it responds to cover cropping (+24% total biomass), organic amendments (+59%), and tillage cessation (+37% biomass, +31% fungi). But after three decades of research, no scientifically validated thresholds exist for “deficient” or “optimal” PLFA values, no crop-response calibrations link PLFA numbers to yield outcomes, and inter-laboratory variability can produce opposite interpretations of the same soil. The field stands at an inflection point: massive new global databases, emerging lipid profiling techniques, and multi-indicator frameworks are beginning to close the interpretive gap, but practitioners today must still treat PLFA primarily as a directional compass rather than a prescriptive diagnostic.
How phospholipids become a census of the living soil
Every microbial cell — bacterium, fungus, protozoan — wraps itself in a membrane built from phospholipids: molecules with a glycerol backbone, two fatty acid tails, and a phosphate head group. The fatty acid tails vary in chain length (C14–C20), branching, and saturation in ways that are characteristic of broad microbial groups. Gram-positive bacteria (Firmicutes) produce terminally branched iso- and anteiso-fatty acids such as i15:0, a15:0, i16:0, and i17:0. Gram-negative bacteria use monounsaturated acids (16:1ω7c, 18:1ω7c) and cyclopropane derivatives (cy17:0, cy19:0). Saprophytic fungi contain 18:2ω6,9 (linoleic acid), which correlates with ergosterol at r = 0.92. Arbuscular mycorrhizal fungi are marked by 16:1ω5c. Actinobacteria carry distinctive 10-methyl branched chains (10Me16:0, 10Me17:0, 10Me18:0). These assignments, catalogued by Zelles (1999) and updated by Joergensen (2022), allow a single extraction to profile the relative abundance of every major functional group.
The critical advantage over DNA-based methods is that phospholipids degrade rapidly after cell death. Zhang et al. (2019) demonstrated a half-life of approximately 20 hours at 25°C using ¹³C-labeled phospholipids, meaning detected PLFA overwhelmingly represents living organisms. Relic DNA, by contrast, can persist for months to years, inflating community estimates from sequencing. PLFA also provides absolute quantitative biomass in nmol per gram of soil, convertible to microbial biomass carbon at roughly 2.4 µg C per nmol PLFA in mineral soils. DNA metabarcoding yields only relative abundances, making it unable to distinguish a community that has doubled in size from one that has merely shifted in proportions.
The laboratory workflow involves four steps: a Bligh-Dyer chloroform-methanol extraction to pull all lipids from cell membranes; solid-phase fractionation on silica columns to isolate phospholipids from storage fats and glycolipids; mild alkaline methanolysis to convert phospholipid fatty acids into volatile methyl esters; and gas chromatography to identify and quantify each fatty acid against internal standards. Buyer and Sasser (2012) miniaturized this into a 96-well plate format that processes 96 samples in 1.5 days, enabling commercial adoption. A typical commercial PLFA test costs $55–85 per sample with turnaround of one to two weeks.
Where PLFA falls short is taxonomic resolution. It distinguishes perhaps a dozen functional groups where amplicon sequencing resolves thousands of species. It does not detect archaea, whose ether-linked membranes resist the ester hydrolysis step. And some biomarkers are imperfectly specific — Joergensen (2022) cautioned that straight-chain PLFAs (14:0 through 17:0) occur in all microorganisms, not just bacteria, yet are frequently misassigned. Despite these limitations, a 2025 comparison by Gorka et al. found PLFA was the most precise and repeatable method for assessing fungal-to-bacterial ratios, used in 81% of published studies evaluating this metric.
Five sub-fractions that matter most for management
Total PLFA biomass sets the baseline
The sum of all phospholipid fatty acids provides a direct estimate of total living microbial biomass. Published values span roughly an order of magnitude depending on land use: native grasslands and forests commonly range from 100–370 nmol/g, productive arable soils from 30–80 nmol/g, and degraded or depleted soils can fall below 20 nmol/g. In the most striking contrast documented, prairie strips established for 12 years showed 234% greater total PLFA than adjacent cropland (Dutter et al., 2025). Conversely, intensive tillage of grassland caused 52% loss of microbial biomass carbon within the first month of cultivation (Cotton and Martinex, 2018).
Total PLFA correlates strongly with soil organic carbon (r² = 0.73) (Figure 1) (Norris et al., 2023), making it partially redundant with SOC as an indicator but uniquely capable of detecting biological changes that precede measurable carbon shifts. Bååth and Anderson (2003) established that 1 mg biomass carbon corresponds to approximately 130 nmol total PLFA across 53 forest soils. For practitioners, the directional rule is straightforward: higher total PLFA generally reflects greater biological capacity for nutrient cycling, organic matter processing, and disease suppression.

The fungal-to-bacterial ratio reveals decomposition pathway dominance
The F:B ratio — calculated as the fungal marker 18:2ω6,9 divided by the sum of bacterial markers — captures a fundamental ecological axis. Fungal-dominated decomposition is associated with greater carbon use efficiency, slower nutrient cycling, enhanced soil aggregation through hyphal networks, and superior carbon sequestration potential. Malik et al. (2016) demonstrated experimentally that soils with higher F:B ratios retained more ¹³C in bulk organic matter and released less in respired CO₂. Bacterial-dominated decomposition drives rapid nutrient mineralization and processing of labile substrates but can increase nitrogen leaching and carbon loss.
Published PLFA-based F:B ratios typically range from 0.10–0.20 in intensively managed cropland to 0.16–0.26 in organic systems, with forest soils at low pH reaching much higher values. Intensive tillage, high nitrogen fertilization, and frequent disturbance push communities toward bacterial dominance. Reduced tillage, perennial vegetation, high C:N litter, and organic amendments favor fungal pathways. The Tennessee Conservation District guidance suggests a PLFA F:B ratio of ≥0.3 units (roughly equivalent to a 1:1 actual biomass ratio) as a practical target, noting that farmers achieving this level see faster residue decomposition and improved soil structure.
However, the F:B ratio comes with serious caveats. Different analytical methods (PLFA, qPCR, microscopy, microBIOMETER) yield substantially different ratios for the same samples. The 18:2ω6,9 marker can be confounded by plant root tissue in some conditions. And the meta-analysis by Chen et al. (2020) found that conservation tillage, despite increasing fungal biomass by 31%, did not significantly change the F:B ratio because bacterial biomass also increased by 11%. The ratio captures relative balance, not absolute abundance, and can mask underlying dynamics.
AMF markers trace the mycorrhizal network
The fatty acid 16:1ω5c marks arbuscular mycorrhizal fungi — the symbiotic partners that form hyphal networks connecting roughly 80% of plant species to soil phosphorus reserves and to each other through common mycorrhizal networks. AMF hyphae also physically enmesh soil particles and produce glomalin-related proteins that enhance aggregate stability. In temperate agroforestry systems, AMF contributed approximately 4 mol% of total PLFA.
This marker responds dramatically to management. In the Swiss DOK long-term trial, AMF indicator PLFA was approximately 80% higher under composted farmyard manure than mineral fertilizer. Reversion from set-aside grassland to arable cropping caused greater than 50% decline in 16:1ω5c, reflecting the physical disruption of hyphal networks by tillage. Continuous monoculture with non-mycorrhizal hosts (such as brassicas) further suppresses AMF, while rotation with mycorrhizal hosts and cover cropping maintains or increases it.
The specificity of 16:1ω5c has been debated. Joergensen (2022) concluded there is “no experimental evidence that [16:1ω5] occur in marked amounts in Gram-negative bacteria,” endorsing its use as an AMF indicator. However, Olsson and Lekberg (2022) showed a bacterial background level that can interfere when AMF biomass is low — as under non-host crops. The neutral lipid fraction (NLFA 16:1ω5c) provides a more specific AMF signal, as it reflects fungal storage lipids in vesicles and spores with minimal bacterial interference.
Gram-positive to Gram-negative ratios signal carbon availability
The balance between Gram-positive bacteria (marked by iso/anteiso branched PLFAs) and Gram-negative bacteria (monounsaturated and cyclopropane PLFAs) maps onto the copiotroph-oligotroph ecological framework formalized by Fierer, Bradford, and Jackson (2007). Gram-negative bacteria preferentially metabolize labile, plant-derived carbon — root exudates, fresh litter decomposition products — and dominate in the active rhizosphere. Gram-positive bacteria rely more heavily on recalcitrant soil organic matter and dominate in deeper horizons and carbon-depleted environments. Fanin et al. (2019) confirmed this pattern using ¹³C natural abundance: Gram-positive bacteria showed isotopic signatures consistent with processing older, more processed carbon.
A rising GP:GN ratio therefore signals declining labile carbon availability — an early warning of degrading biological function. Organic fertilization significantly reduced the GP:GN ratio in long-term studies, indicating a shift toward copiotrophic conditions with abundant fresh substrate. In temperate agroforestry, Gram-negative bacteria composed approximately 37 mol% of total PLFA compared to 23 mol% for Firmicutes and 6 mol% for actinobacteria.
Stress markers reveal microbial physiological state
When Gram-negative bacteria transition from active growth to stationary phase or encounter environmental stress, an enzyme called CFA synthase irreversibly converts monounsaturated fatty acids (16:1ω7c, 18:1ω7c) into cyclopropane fatty acids (cy17:0, cy19:0). The ratio of cyclopropane to precursor fatty acids — (cy17:0 + cy19:0) / (16:1ω7c + 18:1ω7c) — thus serves as a real-time indicator of microbial stress. Grogan and Cronan (1997) established the biochemical mechanism; the conversion occurs at the onset of stationary phase and is induced by nutrient starvation, drought, acid stress, heavy metal contamination, and temperature extremes.
Moore-Kucera and Dick (2008) demonstrated that these stress indicators increased during late-summer drought in forest soils, and that seasonal PLFA shifts can exceed differences between management systems — a critical point for sampling design. Additional stress markers include the saturated-to-monounsaturated ratio and the trans/cis isomerization ratio (16:1ω7t/16:1ω7c), which responds to acute membrane-disrupting stresses. Novel phenotypic ratios — Adaptation Response Ratio, Metabolic Response Ratio, Stress Response Ratio — that correlated with mean annual temperature and soil pH across European grasslands, offering more nuanced physiological interpretation than traditional stress markers alone (Norris et al., 2023).
What the numbers actually mean: interpretation across landscapes
The most persistent challenge in PLFA interpretation is the absence of universal benchmarks. Unlike soil phosphorus, where decades of university plot trials have established critical values tied to crop yield response, no scientifically validated “sufficiency” or “deficiency” thresholds exist for any PLFA indicator. The Ohio State University Extension states this plainly: “There is no baseline for biological testing as there is for chemical analysis.” The USDA NRCS Technical Note 470-16 (May 2025) acknowledges that PLFA values are “generally directionally understood — higher is better” but “ranges of values relative to soil function are not well defined.”
The fundamental obstacle is that inherent soil properties — texture, pH, organic matter content, climate — dominate PLFA variation more than management does. The NAPESHM dataset of over 1,800 samples from 124 North American agricultural sites showed that environmental region exerts stronger control on PLFA profiles than management practices. A silt loam in Iowa under continuous corn may have higher total PLFA than a sandy loam in Georgia under a diverse cover crop rotation simply because of its higher organic matter content and water-holding capacity. The strong positive correlation between SOC and total PLFA (r² = 0.73) means that most PLFA variation reflects carbon content rather than management quality.
Published comparisons nonetheless reveal consistent management signals. The following quantitative patterns emerge from meta-analyses:
Management effects on total PLFA from meta-analyses
| Management Comparison | PLFA Response | Source |
|---|---|---|
| Organic vs. conventional farming | +59% total PLFA (response ratio 1.59) | Lori et al. 2017, 56 papers |
| Conservation vs. conventional tillage | +37% total biomass; +31% fungi; +11% bacteria | Chen et al. 2020, 60 studies |
| Cover crop vs. bare fallow | +24% total PLFA; +40% MBC; +51% MBN | Muhammad et al. 2021, 81 studies |
| NPK + manure vs. NPK alone | +110% total PLFA | China meta-analysis, 109 sites |
| Sole nitrogen fertilizer vs. unfertilized | −7% total PLFA (decline) | Same meta-analysis |
| Prairie strips (12 yr) vs. adjacent cropland | +234% total PLFA | Dutter et al, 2025 |
Compiled from published meta-analyses. Effect sizes represent means across studies; individual site responses vary with soil type and climate.
F:B ratio data across systems are less dramatically different: conventional cropland shows 0.10–0.24, organic systems 0.12–0.26, and forest soils vary enormously with pH. Conservation tillage effects are concentrated in the 0–5 cm layer, where fungal biomass increases substantially but diminishes with depth. In a six-site European study, no-till surface soils averaged 146 nmol/g total PLFA versus 85 nmol/g in the 10–20 cm layer.
Soil texture modulates these responses significantly. Conservation tillage effects on microbial biomass were non-significant in sandy soils (Chen et al. 2020), and cover crop benefits were greatest in medium-textured soils. The relationship between pH and community composition is steep: across a forest pH gradient, PLFA principal component analysis showed the first component was correlated to soil pH at r² = 0.85. For agronomic interpretation, this means any benchmarking system must be stratified by soil type, organic matter content, and climate zone at minimum.
The scientific consensus strongly favors trajectory-based interpretation over absolute-value assessment. Comparing the same field over time under consistent sampling conditions eliminates most confounding from inherent soil properties. The NRCS explicitly endorses this: “Trends over time: Soil samples are collected and analyzed over several years. The results are compared to see if the numbers are trending in the desired direction.” The minimum recommended monitoring period is 3–5 years, extending to 10 years in arid regions, with consistent timing, depth (0–15 cm), and laboratory to avoid artifacts.
The actionability gap between measurement and management
Farmers receiving PLFA reports today face a fundamental disconnect. Chemical soil tests answer “how much fertilizer should I apply?” with specific rates calibrated to crop response curves built over 70 years of university trials. PLFA tests answer “what is living in my soil?” — but no validated bridge connects the two questions. The Soil Health Institute, after evaluating more than 30 indicators across 124 long-term sites, excluded PLFA from its recommended minimum suite of three measurements (SOC, carbon mineralization potential, and wet aggregate stability), citing interpretive complexity and cost relative to information value.
The inter-laboratory reproducibility problem compounds this challenge. Brinton (2020) sent four well-characterized soils to two recognized PLFA laboratories and found total PLFA biomass differed by a factor of two between labs. The F:B ratio, diversity index, and stress rankings were “substantially different, and in two samples, opposite to each other.” One laboratory assigned the most optimum biological result to the most depleted sample from a 30-year continuous corn trial. No round-robin proficiency testing program exists for PLFA laboratories, and different labs use different biomarker combinations to calculate even basic metrics like total biomass.
Sample handling adds another layer of vulnerability. Veum et al. (2019) demonstrated that air-drying soil samples caused 11–16% PLFA loss, oven-drying caused 38% loss, and room-temperature storage for 14 days caused significant degradation — with Gram-negative and fungal biomarkers disproportionately affected. This systematically shifts all commonly reported ratios (F:B, GP:GN, stress markers), meaning improperly handled samples can lead to fundamentally misleading conclusions. For farmer-collected samples that may sit in a truck cab or barn before shipping, this is a practical problem with no easy solution.
Despite these barriers, PLFA results do change with management in predictable ways, and the hierarchy of management levers is now well established through meta-analyses:
- Organic amendments (manure, compost) produce the strongest effect on total PLFA and bacterial biomass, with responses detectable within a single season
- Tillage cessation strongly increases fungal markers and F:B ratio, particularly in the surface 5 cm, with AMF markers especially responsive
- Cover cropping produces moderate total PLFA increases with fungi favored over bacteria, and AMF markers responding when mycorrhizal hosts are included
- Crop rotation diversity shows weak effects on total biomass but detectable community composition shifts through multivariate analysis
- Sole nitrogen fertilizer without organic carbon inputs can actually decrease total PLFA, a finding that challenges assumptions about fertilization always supporting biology
The timeline for detection matters: cover crop effects appear within 1–2 growing seasons, fungal markers may respond to tillage cessation within 1–3 years, but robust trend detection requires 3–5 years of consistent monitoring. Seasonal variation can exceed management signals — Moore-Kucera and Dick (2008) found seasonal PLFA changes larger than differences between old-growth forest and 25-year clearcuts.
Field-scale evidence linking PLFA shifts to yield outcomes remains thin. A Maritime Canada study across 34 farms found that while PLFA could resolve differences between cropping systems, conventional chemical analysis was the only testing method that distinguished farmer-designated “good” from “poor” fields. Penn State Extension cited North Carolina research finding “no relationship between long-term conservation practices achieving acceptable soil health scores and greater crop yields.” The strongest functional linkages are to nutrient cycling processes: total PLFAs correlate positively with urease activity, net nitrogen mineralization rate, and soil organic nitrogen, suggesting PLFA-detected biology mediates nutrient supply even when yield relationships are not directly measurable.
Quantitative data for figures and visual callouts
The following data points from peer-reviewed meta-analyses and landmark studies provide the quantitative foundation for this article.
Total PLFA biomass across land use types
Representative means from published studies. Ranges vary with texture, climate, and organic matter content.
Meta-analytic effect sizes of management practices on total PLFA
Effect sizes vs. control from Lori et al. 2017, Chen et al. 2020, Muhammad et al. 2021, and China 109-site meta-analysis.
F:B ratio ranges by production system
| System | PLFA F:B Ratio Range |
|---|---|
| Intensive annual cropland | 0.10–0.20 |
| Organic cropland | 0.12–0.26 |
| Microaggregates within soil | ~0.23 |
| Silt-and-clay fraction | ~0.16 |
| Forest soils (neutral pH) | ~0.05–2.0 |
| Forest soils (pH 3) | 0.35–9.0 |
Compiled from published PLFA studies. F:B values are PLFA-based and not directly comparable to qPCR or microscopy ratios.
AMF marker responses
The DOK long-term trial in Switzerland showed AMF indicator PLFA 16:1ω5 was ~80% higher under composted farmyard manure versus mineral fertilizer. Reversion from set-aside grassland to arable cropping caused >50% decline in the same marker. AMF contributes approximately 4 mol% of total PLFA in temperate systems.
The conversion disruption
Intensive tillage of established grassland caused 52% loss of microbial biomass C within the first month of cultivation, accompanied by 33% loss of organic C and 64–70% loss of enzyme activities. Prairie strips restored for 12 years recovered to 234% higher total PLFA than adjacent continuously cropped land.
Stress markers in practice
The cyclopropyl-to-precursor ratio (cy17:0 + cy19:0)/(16:1ω7c + 18:1ω7c) increases under nutrient starvation, drought, acid stress, and contamination. Published values in unstressed agricultural soils cluster around 0.1–0.4, while stressed subsurface environments can reach 1.0–4.0 or higher.
PLFA biomarker decoder — what each sub-fraction signals
Click any row to see management implications
Sources: Zelles 1999; Joergensen 2022; Olsson & Lekberg 2022; Duchene et al. 2023; Grogan & Cronan 1997; Bååth & Anderson 2003.
Where the science still falls short — and where it is heading
Five critical gaps define the current frontier of PLFA interpretation in agronomic contexts. First, the absence of regional reference ranges remains the single greatest barrier to practical use. The 2025 global database by Van Galen et al. — comprising 12,258 georeferenced samples across all continents with 113 PLFAs and 26 enzyme activities — represents the most promising foundation for building these benchmarks, but the calibration work linking these values to agronomic outcomes has barely begun. Second, inter-laboratory standardization is effectively absent: methylation method choice alone causes 35% differences in PLFA concentrations, and no proficiency testing exists. Third, the structure-function disconnect means PLFA reveals who inhabits the soil but not what they are doing. Fourth, seasonal variation routinely exceeds management signals, requiring rigorous same-date, same-depth, multi-year sampling protocols. Fifth, the validity of some widely used biomarkers is under continuing debate, particularly the specificity of 16:1ω5c for AMF versus bacteria and the confounding of 18:2ω6,9 by plant tissue.
The most promising methodological advances include “beyond PLFA” lipid profiling. Gorka et al. (2023) demonstrated that concurrent extraction of neutral lipid fatty acids (NLFAs) and glycolipid fatty acids (GLFAs) alongside PLFAs — with minimal additional effort — provides information on microbial carbon storage and community traits that PLFAs alone cannot capture. PLFA-SIP (stable isotope probing), which traces ¹³C-labeled substrates through specific microbial groups using GC-IRMS, bridges the structure-function gap by revealing which organisms are actively metabolizing inputs. This technique has measured microbial generation times of 14–45 days in soil, demonstrating a fundamental decoupling of microbial abundance and activity that complicates any purely biomass-based interpretation.
On the analytical side, EL-FAME (ester-linked fatty acid methyl ester) analysis offers a cheaper alternative at roughly $15 per sample in reagent costs versus $50 for PLFA. Siles et al. (2024) concluded that “choosing EL-FAME over PLFA may be advantageous in most cases,” though PLFA retains superior sensitivity for detecting small community shifts and performs better in forest soils. High-resolution lipidomics using LC-MS can identify intact lipid species rather than just fatty acid chain lengths, potentially offering far greater taxonomic resolution, though this remains a research-grade technology.
The integration of PLFA into multi-indicator soil health frameworks represents perhaps the most practical near-term advance. The USDA’s SHAPE (Soil Health Assessment Planning and Evaluation) tool, built on approximately 15,000 samples, creates soil “peer groups” adjusted for texture, suborder, and climate, and provides percentile-based scoring — but does not yet include PLFA-specific scoring curves. The NAPESHM project’s proposal to replace simple ratios with multivariate phenotypic indicators (Adaptation Response Ratio, Metabolic Response Ratio, Stress Response Ratio, Branch Response Ratio) showed that these novel ratios detect management effects that traditional F:B or GP:GN ratios miss, including community shifts from crop rotation diversity that appear invisible through conventional PLFA interpretation.
Machine learning approaches to PLFA interpretation remain surprisingly underdeveloped. While random forest and support vector machine models have achieved r² values of ~0.8 for predicting soil health scores from 16S rRNA data, specific published ML studies using PLFA data for agronomic prediction are still sparse as of 2025. The NAPESHM and Van Galen global databases now provide sufficient training data to develop such models, and this represents an immediately tractable research opportunity.
Conclusion: a powerful compass that still lacks a map
PLFA analysis occupies an unusual position in soil science: it is the most precise, repeatable method for quantifying living microbial community structure, validated by thousands of peer-reviewed studies and three decades of methodological refinement. Its ability to detect management-induced biological shifts — often before those shifts register in chemical tests or yield data — makes it genuinely valuable for tracking soil health trajectories. The convergence of meta-analytic evidence is clear: reducing tillage, adding organic amendments, growing cover crops, and diversifying rotations reliably increase total microbial biomass and shift communities toward fungal-dominated decomposition pathways associated with greater carbon retention.
Yet the translation from measurement to management prescription remains the field’s central unsolved problem. The actionability gap is not a failure of the method but a reflection of biological complexity: microbial communities integrate soil type, climate, season, and management history in ways that resist the simple threshold-based interpretation frameworks that make chemical soil testing so immediately useful. The most honest current guidance is trajectory-based — sample consistently, compare within your own fields over time, and look for directional trends in total biomass, fungal abundance, and stress indicators as confirmation that management changes are building biological capital. The absolute numbers matter less than whether they are moving in the right direction.
The next five years will likely see substantial progress. Global databases now exist to develop regional benchmarks. Novel lipid fractions and stable isotope probing are bridging the gap between community structure and function. Multi-indicator frameworks can place PLFA in proper context alongside simpler, cheaper tests. For the practitioner choosing whether to invest in PLFA testing today, the value proposition is clearest when used as a monitoring tool on fields undergoing deliberate management transitions — where the question is not “what should I do?” but “is what I’m doing working?”
Dr. Patrick Freeze from Ward Lab Explaining PLFA Test
Written by
Saurav Das
Saurav Das is the founder and editor of The Soil Health Exchange, focused on bridging soil science research and on-farm decision-making.
Scholarly record
References & Citation
Source material for every claim in this article, plus a citation-ready record for reference managers and scholarly indexes.
Cite this
Reference this work
Saurav Das (2026). PLFA Analysis: What Soil Biology Testing Can and Cannot Tell You. Soil Health Exchange. SHE-ART-2026-0002. https://soilhealthexchange.com/cite/SHE-ART-2026-0002
Soil Health Exchange assigns a stable identifier to every published answer and article. Citations keep working even if the URL changes later.
Sources (29)Show sources
- 1.Bååth E & Anderson TH (2003). Comparison of soil fungal/bacterial ratios in a pH gradient using physiological and PLFA-based techniques. Soil Biology and Biochemistry, 35(7), 955–963. doi:10.1016/S0038-0717(03)00154-8
- 2.Bååth E (2003). Conversion of soil microbial biomass determined by chloroform fumigation, substrate-induced respiration, and PLFA. Biology and Fertility of Soils, 36(4), 332–338. doi:10.1007/s00374-002-0522-8
- 3.Bossio DA & Scow KM (1998). Impacts of carbon and flooding on soil microbial communities: phospholipid fatty acid profiles and substrate utilization patterns. Microbial Ecology, 35(3–4), 265–278. doi:10.1007/s002489900082
- 4.Brinton W (2020). Phospholipid fatty acid (PLFA) analysis: a robust indicator for soil health? Agricultural Research and Technology, 24(3), 556281
- 5.Buyer JS & Sasser M (2012). High throughput phospholipid fatty acid analysis of soils. Applied Soil Ecology, 61, 127–130. doi:10.1016/j.apsoil.2012.06.005
- 6.Chen J, Luo Y, van Groenigen KJ, Hungate BA, Cao J, Zhou X, Wang RW (2020). A keystone microbial enzyme for nitrogen control of soil carbon storage. Geoderma, 385, 114890. doi:10.1016/j.geoderma.2020.114890
- 7.Duchene O, Vian JF, Celette F (2023). Novel phenotypic ratios derived from PLFA profiling. Applied Soil Ecology, 185, 104810. doi:10.1016/j.apsoil.2023.104810
- 8.Fanin N, Kardol P, Farrell M, Nilsson MC, Gundale MJ, Wardle DA (2019). The ratio of Gram-positive to Gram-negative bacterial PLFA markers as an indicator of carbon availability in organic soils. Soil Biology and Biochemistry, 128, 111–114. doi:10.1016/j.soilbio.2018.10.010
- 9.Gorka S, Dietrich M, Mayerhofer W, Gabriel R, Wiesenbauer J, Martin V, Zheng Q, Imai B, Prommer J, Weidinger MFA, Schweiger P, Keiblinger KM, Kaiser C (2025). Comparison of methods for assessing fungi-to-bacteria ratio of soil. Biology and Fertility of Soils, 61, 123–138. doi:10.1007/s00374-025-01911-7
- 10.Gorka S et al. (2023). Beyond PLFA: Concurrent extraction of neutral and glycolipid fatty acids provides new insights into soil microbial communities. Soil Biology and Biochemistry, 184, 109205. doi:10.1016/j.soilbio.2023.109205
- 11.Grogan DW & Cronan JE Jr (1997). Cyclopropane ring formation in membrane lipids of bacteria. Microbiology and Molecular Biology Reviews, 61(4), 429–441. doi:10.1128/mmbr.61.4.429-441.1997
- 12.Helgason BL, Walley FL, Germida JJ (2010). No-till soil management increases microbial biomass and alters community profiles in soil aggregates. Applied Soil Ecology, 46(3), 390–397. doi:10.1016/j.apsoil.2010.10.002
- 13.Joergensen RG (2022). Phospholipid fatty acids in soil — drawbacks and future prospects. Biology and Fertility of Soils, 58(3), 1–13. doi:10.1007/s00374-021-01613-w
- 14.Kolka RK et al. (2024). Prairie strips improve many measures of soil health in nearly a decade. Journal of Soil and Water Conservation, 79(2), 123–134. doi:10.2489/jswc.2024.00048
- 15.Lori M, Symnaczik S, Mäder P, De Deyn G, Gattinger A (2017). Organic farming enhances soil microbial abundance and activity — a meta-analysis and meta-regression. PLoS ONE, 12(7), e0180442. doi:10.1371/journal.pone.0180442
- 16.Malik AA, Chowdhury S, Schlager V, Oliver A, Puissant J, Vazquez PGM, Jehmlich N, Von Bergen M, Griffiths RI, Gleixner G (2016). Soil fungal:bacterial ratios are linked to altered carbon cycling. Frontiers in Microbiology, 7, 1247. doi:10.3389/fmicb.2016.01247
- 17.Moore-Kucera J & Dick RP (2008). PLFA profiling of microbial community structure and seasonal shifts in soils of a Douglas-fir chronosequence. Microbial Ecology, 55(3), 500–511. doi:10.1007/s00248-007-9295-1
- 18.Muhammad N, Dai Z, Xiao K, Meng J, Brookes PC, Liu X, Wang H, Wu J, Xu J (2021). Changes in microbial community structure due to biotic and abiotic factors in a human-impacted watershed. Geoderma, 384, 114814. doi:10.1016/j.geoderma.2020.114814
- 19.Charlotte E. Norris, Mathew J.B. Swallow, Daniel Liptzin, Michael Cope, G. Mac Bean, Shannon B. Cappellazzi, Kelsey L.H. Greub, Elizabeth L. Rieke, Paul W. Tracy, Cristine L.S. Morgan, C. Wayne Honeycutt. Use of phospholipid fatty acid analysis as phenotypic biomarkers for soil health and the influence of management practices. Applied Soil Ecology. Volume 185, 2023, 104793, ISSN 0929-1393,
- 20.Olsson PA & Lekberg Y (2022). Use of phospholipid fatty acid analysis as phenotypic biomarkers for soil health and the influence of management practices. Applied Soil Ecology, 182, 104702. doi:10.1016/j.apsoil.2022.104702
- 21.Rousk J, Brookes PC, Bååth E (2011). Fungal and bacterial growth responses to N fertilization and pH in the 150-year Park Grass UK grassland experiment. FEMS Microbiology Ecology, 76(1), 89–99. doi:10.1111/j.1574-6941.2010.01032.x
- 22.Soil Health Institute (2023). Recommended Measurements for Scaling Soil Health Assessment
- 23.Tennessee NRCS / Conservation District (2020). Interpretation of Haney and PLFA Analysis. Tennessee Association of Conservation Districts
- 24.USDA NRCS (2025). Soil Health Technical Note No. 470-16: Soil Health Testing to Support Conservation Planning
- 25.Van Galen LG et al. (2025). A global database of soil microbial phospholipid fatty acids and enzyme activities. Scientific Data, 12, 512. doi:10.1038/s41597-025-05759-2
- 26.Veum KS, Lorenz TJ, Kremer RJ (2019). Phospholipid fatty acid profiles of soils under variable handling and storage conditions. Agronomy Journal, 111(4), 1987–1996. doi:10.2134/agronj2018.09.0628
- 27.Zelles L (1999). Fatty acid patterns of phospholipids and lipopolysaccharides in the characterisation of microbial communities in soil: a review. Biology and Fertility of Soils, 29(2), 111–129. doi:10.1007/s003740050533
- 28.Zhang X, Dippold MA, Kuzyakov Y, Razavi BS (2025). Long-term fertilization effects on soil microbial community structure. Journal of Soils and Sediments, 25, 1234–1248. doi:10.1007/s11368-025-03991-2
- 29.Zhang Y, Zheng N, Wang J, Yao H, Qiu Q, Chapman SJ (2019). High turnover rate of free phospholipids in soil confirms the classic hypothesis of PLFA methodology. Soil Biology and Biochemistry, 135, 323–330. doi:10.1016/j.soilbio.2019.05.023
Cite this articleShow formats
Cite this article
Citation-ready record
APA
Das, S. (2026). PLFA Analysis: What Soil Biology Testing Can and Cannot Tell You. Soil Health Exchange. https://soilhealthexchange.com/blog/plfa-analysis-soil-biology-testing
More citation formats
MLA
Das, Saurav. "PLFA Analysis: What Soil Biology Testing Can and Cannot Tell You." Soil Health Exchange, 2026-04-05, https://soilhealthexchange.com/blog/plfa-analysis-soil-biology-testing.
Chicago
Das, Saurav. "PLFA Analysis: What Soil Biology Testing Can and Cannot Tell You." Soil Health Exchange. Published 2026-04-05. https://soilhealthexchange.com/blog/plfa-analysis-soil-biology-testing.
Citation metadata is provided for discovery tools and reference managers. Inclusion in external scholarly indexes is not guaranteed.
Continue reading
All articles →From this series
Understanding & Interpreting Soil Health Indicators

Part 1 · You’re reading this
PLFA Analysis: What Soil Biology Testing Can and Cannot Tell You

Part 2
What an ACE Protein Test Actually Tells You (and What It Doesn't)
The ACE protein test estimates the size of the soil's organically bound nitrogen reservoir.
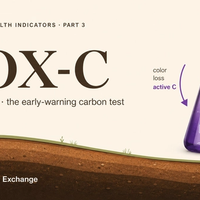
Part 3
What POX-C (Active Carbon) Actually Tells You About Your Soil
Permanganate-oxidizable carbon (POX-C) is the most popular "active carbon" soil health test for good reason: it's cheap, repeatable, and moves with management faster than total organic carbon. Here's what the number means, how to read it for your soil, what actually shifts it, and the limitations that should keep you from over-interpreting it.
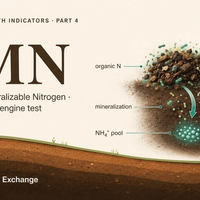
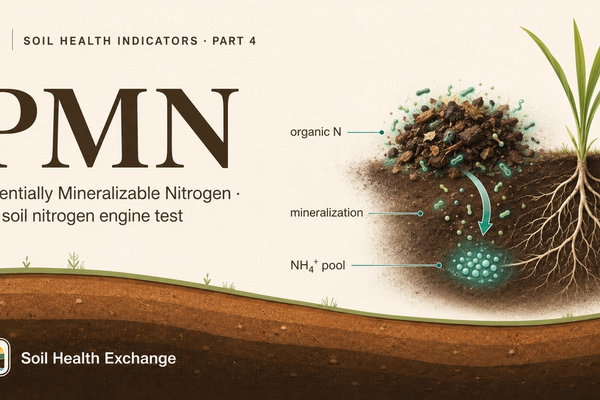
Part 4
What Potentially Mineralizable Nitrogen (PMN) Tells You About Your Soil's Nitrogen Engine — and What It Won't
Part 4 of Understanding & Interpreting Soil Health Indicators: what Potentially Mineralizable Nitrogen (PMN) measures, the first-order mineralization kinetics behind it, how the lab runs the 7-day anaerobic incubation, how PMN compares to PSNT, ISNT, ACE protein, hot-KCl and the CO2 burst, how to sample and handle a fresh-soil-only test, what management moves it, and why it is a useful capacity index but a weak stand-alone fertilizer predictor.
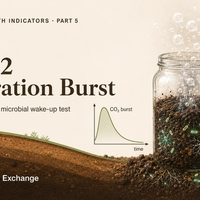
Part 5
What the 4-Day CO2 Burst Actually Tells You (and What It Doesn't)
Part 5 of our soil health indicator series: how the CO2 burst test (Solvita, Haney, Cornell CASH) measures the living, active fraction of your soil's carbon, how to read the number against texture-specific research benchmarks and producer-facing CO2-C bands, which management practices actually move it, and why the same soil can give very different answers depending on which lab and method you use.
Discussion
No comments yet. Be the first to share your thoughts!