If you have ever pulled a 0–8 inch nitrate sample in April and gotten a result you did not trust, you already understand the limit of inorganic nitrogen testing. Mineral N moves, and the form determines the loss pathway: nitrate leaches with spring rain and gets denitrified in saturated zones, ammonia volatilizes after surface urea applications, and ammonium and nitrate alike get immobilized whenever a high-carbon residue lands on the soil surface. A potassium chloride (KCl) extraction tells you how much nitrate (and, depending on the lab, ammonium) is sitting in the soil at the moment you pulled the core, not how much your soil can supply across a growing season.
That gap between what is currently mineral and what is potentially mineralizable has been the central problem in agronomic nitrogen management for over a century. The autoclaved citrate extractable (ACE) protein test, included in the USDA-NRCS CEMA 216 soil health testing program as the bioavailable nitrogen indicator (USDA-NRCS, 2024), is one of the more promising attempts to fill that gap with a routine, commercially scalable measurement.
Here, we'll cover what the test is, what it actually measures, where it earns its place in a soil health package, and where the science still asks us to be careful about interpretation.
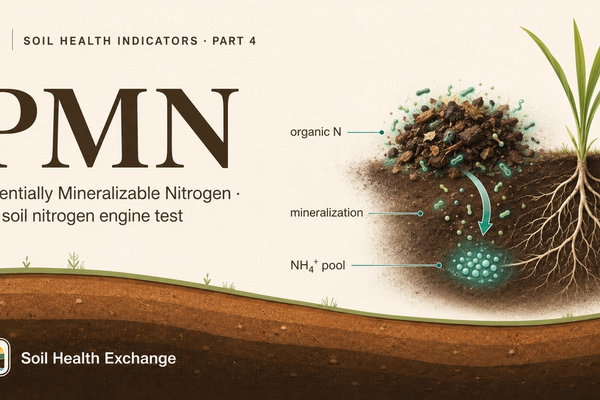
Figure 1. The two soil nitrogen pools. Inorganic N (NO₃⁻, NH₄⁺) is mobile and represents less than 5% of total soil nitrogen; it is what KCl extraction measures and what is lost to leaching, volatilization, and denitrification. Organic N represents roughly 95% of the total and is the reservoir from which mineralization draws over a growing season (Stevenson 1994). The ACE protein test extracts and quantifies a slice of this organic pool, typically 20 to 30% of total soil N, with humic interference inflating values in high-organic-matter soils (Geisseler et al. 2019).
What the test is, and where it came from
The protocol itself is straightforward. A small mass of air-dried, sieved soil (typically 1.0 g) is added to 8 mL of 0.02 mol/L sodium citrate buffer at pH 7. The slurry is autoclaved at 121°C for 30 minutes, cooled, centrifuged, and the supernatant is assayed for protein content (Hurisso et al., 2018). Hurisso and colleagues used the Bradford dye-binding assay in their original validation work; the routine method adopted by the Cornell Soil Health Laboratory and most contemporary commercial labs uses the bicinchoninic acid (BCA) reaction, calibrated against bovine serum albumin (Schindelbeck et al., 2016; Moebius-Clune et al., 2016). The two assays return comparable but not identical values. The result is reported either as milligrams of protein per gram of soil or as grams of protein per kilogram of soil.
Figure 2. The ACE protein laboratory workflow. Air-dried soil (1.0 to 3.0 g, sieved to 2 mm) is extracted in 20 mM sodium citrate buffer at pH 7.0, autoclaved at 121°C for 30 minutes, centrifuged, and the supernatant is assayed for protein content via BCA colorimetry at 562 nm against a bovine serum albumin standard (Hurisso et al. 2018; Schindelbeck et al. 2016). Results are reported as mg protein per g of dry soil and interpreted against texture-stratified reference distributions (Table 2).
The method has an interesting backstory. Wright and Upadhyaya (1996) developed it in the mid-1990s to measure “glomalin,” a glycoprotein they believed was produced primarily by arbuscular mycorrhizal fungi. For roughly two decades, the soil health community treated the result as a fungal biomarker. Hurisso and colleagues (2018) then demonstrated through controlled spike experiments that the same extraction recovered proteins from a wide range of sources, including bacterial proteins, plant residues, and a non-trivial amount of co-extracted humic material, and that the “glomalin” framing was no longer defensible. They proposed renaming the result more honestly as autoclaved citrate extractable soil protein, or ACE protein.
So what is it, really?
The renaming to ACE protein settled the question of whether “glomalin” was a meaningful term, but it did not settle the question of what the original method actually detects. The 1996 glomalin work relied on a monoclonal antibody, MAb32B11, raised against crushed mycorrhizal spores; that antibody was the basis for the immunoassay used to identify and quantify glomalin in soil for nearly three decades. In 2025, Alptekin and colleagues at the University of Wisconsin–Madison reopened the question of what MAb32B11 binds. Using protease digestion, periodate oxidation, size exclusion chromatography, and NMR, they showed that the antibody's target is not a protein at all but a complex polysaccharide in the 511 to 600 kDa range, most likely a cell wall component of arbuscular mycorrhizal fungi. They proposed the name “glomalose” to reflect its carbohydrate nature (Alptekin et al., 2025).
The implication for routine soil testing is narrower than it might first appear. The ACE protein test as run by commercial labs is a colorimetric protein assay on a citrate-autoclave extract, and it does measure proteinaceous compounds along with well-documented humic interferences. What the Alptekin paper changes is the historical claim that the immuno-detected fraction was itself an abundant soil protein of mycorrhizal origin. The ACE protein test was already understood to extract a heterogeneous mixture of compounds, most of them non-mycorrhizal (Hurisso et al., 2018; Gillespie et al., 2011); the new work simply closes the door on the original glomalin-as-protein interpretation.
That history matters. The current value of the test does not depend on a fungal biomarker story. It depends on the broader claim that the citrate-autoclave extraction recovers a meaningful slice of the organically bound nitrogen pool, and that this slice responds to management in ways an inorganic snapshot cannot.
What the number actually represents
The vast majority of nitrogen in surface agricultural soils is held in organic forms. Stevenson (1994) places amino-acid-N and amino-sugar-N together at roughly 30–50 percent of total soil N, with the remainder partitioned among other nitrogen-containing organic compounds and a small inorganic pool that typically falls below 5 percent of the total. ACE protein is a measurement targeted at the proteinaceous fraction of that organic pool, expressed as a single number per gram of soil.
Three points deserve emphasis here.
First, the pool ACE protein measures is large in absolute terms. In the Geisseler et al. (2019) California dataset, ACE protein concentrations ranged from 1.0 to 45.2 g protein per kg of soil across 57 fields representing eight Soil Taxonomy orders. On a nitrogen basis, assuming proteins are roughly 16 percent N, ACE protein-N accounted for an average of 28 percent of total soil N across all sites in that study, but exceeded 60 percent in some high-organic-matter soils. Geisseler and coworkers attributed the implausibly high values to co-extracted humic substances interfering with the protein assay.
Second, the pool is sensitive to management. The North American Project to Evaluate Soil Health Measurements (NAPESHM), a coordinated assessment of more than 30 soil measurements at 124 long-term agricultural research sites across Canada, the United States, and Mexico (Norris et al., 2020; Bagnall et al., 2023), evaluated ACE protein among five candidate nitrogen indicators. Liptzin and colleagues (2023) reported that nitrogen indicators in the dataset increased by between 6 and 39 percent in response to decreased tillage, cover cropping, residue retention, and organic nutrient amendments. Total N and ACE protein were highlighted by Bagnall et al. (2023) as the two N-cycle indicators that responded significantly to all four of those soil health management practices. Long-term manure addition has been shown in the Knorr-Holden continuous maize experiment, the longest-running continuous corn study in North America, to significantly increase ACE protein along with several other soil health indicators (Das et al., 2023).
Third, ACE protein is conceptually a supply-side measurement. It estimates the size of a substrate reservoir that microbes can draw on for mineralization, not the rate at which mineralization is happening on a given afternoon. This is the snapshot-versus-supply distinction that opened this article.
Table 1. Reported ranges of ACE protein in agricultural and reference soils
Long-term mown grassland, untilled since 1959 (KBS LTER, MI)
16.34
—
LTER plots
Naasko et al. 2024
NAPESHM management response (124 long-term sites)
+6 to +39% over baseline
—
124 sites
Liptzin et al. 2023
Values reported as mg protein per g soil (equivalent to g protein per kg soil). NAPESHM response reflects increases under reduced tillage, cover crops, residue retention, and organic amendments.
How well does ACE protein predict nitrogen mineralization?
This is the question that decides how much weight an ACE protein number should carry in a fertilizer decision, and the honest answer is that the science is mixed.
The 2018 introduction by Hurisso and colleagues set high expectations: a useful relationship between ACE protein and organic-N substrate availability across regional datasets. Subsequent independent studies have produced a wider range of results. Geisseler and coworkers (2019), sampling 57 fields across eight soil orders in California, found that ACE protein explained only 21 percent of the variation in potential net N mineralization, performing slightly worse than total soil N alone, with much of the noise attributed to co-extracted humic substances interfering with the BCA assay.
Across a broader set of comparisons summarized in the recent literature, the R² values between ACE protein and laboratory-measured N mineralization range from approximately 0.21 to 0.76 depending on the study, the soil-climate region, and the protein quantification method (Geisseler et al., 2019; Naasko et al., 2024). The Naasko et al. (2024) Michigan dataset, drawn from a 33-year-old eight-system management intensity gradient at the Kellogg Biological Station, demonstrated that ACE protein tracked seasonal N dynamics across a wide range of cropping systems but also that the absolute values varied with sampling time and soil moisture history.
The practical takeaway
ACE protein is a useful but imperfect proxy for the size of the organic N substrate pool. It is more functionally relevant than a single nitrate or ammonium snapshot, and it responds to management in ways that traditional fertility tests do not. It is not, however, a one-number replacement for a side-dress N decision, and it should not be used as a stand-alone fertilizer recommendation tool.
How to read your number, and what to do with it
Where ACE protein shines is as part of an interpretation framework rather than as a stand-alone diagnostic. A few practical guidelines hold up across the literature.
When ACE protein is low for your region and texture class, the soil is functioning with a small organic N reservoir. Mineralization will be modest, fertilizer N will face higher loss risk because there is less organic buffering capacity, and rotational or cover-crop investments are likely to produce the largest absolute gains in the indicator over a 3 to 5 year window. This is the classic situation where biological N supply is constrained.
When ACE protein is moderate to high for your region and texture, the soil holds a meaningful organic N pool. Pre-plant fertilizer N strategies can credibly account for some endogenous mineralization, and post-harvest residual N risk should be evaluated alongside any rate-bumping decision. A reasonable interpretation in this range is that nitrogen availability is no longer the primary biological constraint on yield.
When ACE protein is very high, especially in soils with substantial organic matter or recent manure history, the value should be interpreted with caution. Co-extracted humic substances inflate the colorimetric reading, and the apparent ACE protein value may overstate the truly mineralizable pool (Geisseler et al., 2019). In manured systems, pairing ACE protein with potentially mineralizable N (PMN), respiration, or POXC tightens the picture considerably.
Table 2. Cornell CASH interpretive thresholds for ACE protein, by texture class
Texture Class
Regional Mean ± SD (mg/g)
Low (score 0–30)
Medium / Suboptimal (score 30–70)
Optimal (score 70–100)
Aspirational (score 90, top 10%)
Coarse (sand, loamy sand, sandy loam)
7.4 ± 3.5
< 5.5
5.5 – 9.0
> 9.0
11.9
Medium (loam, silt loam, silt)
6.5 ± 3.3
< 4.5
4.5 – 8.0
> 8.0
10.7
Fine (clay loam, silty clay, clay)
5.9 ± 3.0
< 4.0
4.0 – 7.5
> 7.5
9.7
Cornell's scoring function is a cumulative normal distribution calibrated against regional reference soils, with texture-specific means and standard deviations from Figure 2.34 of the Cornell Framework Manual (Moebius-Clune et al. 2016). Score thresholds in mg/g calculated from the published mean and SD using standard normal quantiles (z = −0.52 for score 30; z = +0.52 for score 70). The Cornell regional dataset is calibrated primarily on Northeast US soils; producers in other regions should treat these values as orientation rather than absolute thresholds, and look for SHAPE-based regional scoring functions (Nunes et al. 2021) where available for their soil-climate zone.
The single most useful management application is trend detection
ACE protein is sensitive enough to track changes from cover cropping, reduced tillage, manure programs, and rotation diversification on a 3 to 5 year scale (Das et al., 2023; Liptzin et al., 2023). Producers using CEMA 216 to document the soil health trajectory of a field will find ACE protein among the more responsive indicators in the panel.
Where ACE protein fits in the broader soil health conversation
The 2023 Soil Health Institute synthesis from Bagnall and colleagues drew on the full NAPESHM dataset of 124 long-term agricultural research sites to recommend a three-indicator minimum suite for routine soil health assessment: soil organic carbon, aggregate stability via slaking image recognition, and 24-hour carbon mineralization potential (Bagnall et al., 2023). ACE protein did not make that minimum cut.
That is worth understanding rather than glossing over. The omission was not because ACE protein is uninformative. Both total N and ACE protein were flagged in that synthesis as highly responsive N-cycle indicators. The minimum-suite framework grouped indicators by ecosystem service and selected a single indicator per group. Because total N and SOC were strongly correlated (r² ≈ 0.92 in the NAPESHM dataset), and ACE protein was in turn strongly correlated with total N, the authors concluded that organic carbon could serve as a reasonable surrogate for the nutrient-cycling ecosystem service in a continental-scale minimum suite. CEMA 216, by contrast, was designed not as a continental minimum suite but as a fuller diagnostic panel, and it explicitly retains ACE protein as the dedicated bioavailable nitrogen indicator alongside SOC, aggregate stability, respiration, and POXC (USDA-NRCS, 2024).
Two methodological developments are worth watching. The first is the Soil Health Assessment Protocol and Evaluation (SHAPE) scoring system being deployed by NRCS, which compares raw ACE protein values to distributions from soils of similar texture and climate, returning a 0 to 100 score rather than an absolute number (USDA-NRCS, 2022). This is the same logic Saurav Das has championed in the Cropland Reference Ecological Unit framework for soil health targets, and it is the right direction for a measurement whose absolute values are deeply context-dependent. The second is the development of pedotransfer-function approaches that predict ACE protein from cheaper and more reproducible measurements such as total N, texture, and SOC (Naasko et al., 2024). These methods may eventually make a “predicted ACE protein” available alongside the laboratory-measured value for routine packages, the same way the Cornell Soil Health Laboratory already reports a predicted protein index in its standard CASH package (Cornell Soil Health Laboratory, 2024).
The ACE protein test is not a perfect oracle for nitrogen management, and treating it as one will produce frustration. What it is, and what it does well, is provide a routinely measurable estimate of the size of the soil's organically bound nitrogen reservoir. That reservoir governs the long-term capacity of a field to supply nitrogen biologically, to buffer against fertilizer mistakes, and to recover from disturbance. Read in regional context, paired with companion indicators, and tracked across years of management change, ACE protein answers a question that nitrate and ammonium tests structurally cannot answer: how much nitrogen does your soil have to give?
The bottom line
That is the question CEMA 216 was designed to put on the table. It is also a question soil health science is still actively refining the answer to.
Test Your Knowledge
Each attempt draws 8 questions from a 12-question pool and shuffles both the questions and answer choices. Score 85% or higher to earn a Certificate of Completion.
1.What does a potassium chloride (KCl) extraction actually tell you about your soil's nitrogen?
2.Conceptually, what kind of measurement is ACE protein?
3.When Hurisso and colleagues (2018) reframed the old 'glomalin' measurement as ACE protein, what did their spike experiments show the citrate-autoclave extraction actually recovers?
4.What did Alptekin and colleagues (2025) conclude about the MAb32B11 antibody that had defined 'glomalin' for decades?
5.In the Geisseler et al. (2019) California study of 57 fields, how well did ACE protein predict potential net nitrogen mineralization?
6.Why does the article warn that a very high ACE protein value should be interpreted with caution?
7.The Bagnall et al. (2023) Soil Health Institute synthesis left ACE protein out of its three-indicator minimum suite. Why?
8.According to the NAPESHM findings the article cites, how did ACE protein compare with other nitrogen indicators in responding to soil health management practices?
Source material for every claim in this article, plus a citation-ready record for reference managers and scholarly indexes.
Cite this
Reference this work
SHE-ART-2026-0005
Patrick Freeze, Ph.D. (2026). What an ACE Protein Test Actually Tells You (and What It Doesn't). Soil Health Exchange. SHE-ART-2026-0005. https://soilhealthexchange.com/cite/SHE-ART-2026-0005
9.Moebius-Clune, B. N., Moebius-Clune, D. J., Gugino, B. K., Idowu, O. J., Schindelbeck, R. R., Ristow, A. J., van Es, H. M., Thies, J. E., Shayler, H. A., McBride, M. B., Kurtz, K. S. M., Wolfe, D. W., & Abawi, G. S. (2016). Comprehensive Assessment of Soil Health: The Cornell Framework, Edition 3.2. Cornell University, Geneva, NY
12.Schindelbeck, R. R., Moebius-Clune, B. N., Moebius-Clune, D. J., Kurtz, K. S., & van Es, H. M. (2016). Cornell Soil Health Laboratory: Comprehensive Assessment of Soil Health Standard Operating Procedures. Cornell University, Ithaca, NY
13.Stevenson, F. J. (1994). Humus Chemistry: Genesis, Composition, Reactions (2nd ed.). John Wiley & Sons, New York
15.USDA-NRCS. (2024). FY25 CEMA 216 Soil Health Testing technical document. United States Department of Agriculture, Natural Resources Conservation Service
Ph.D., P. F. (2026). What an ACE Protein Test Actually Tells You (and What It Doesn't). Soil Health Exchange. https://soilhealthexchange.com/blog/what-an-ace-protein-test-actually-tells-you
More citation formats
MLA
Ph.D., Patrick Freeze,. "What an ACE Protein Test Actually Tells You (and What It Doesn't)." Soil Health Exchange, 2026-05-05, https://soilhealthexchange.com/blog/what-an-ace-protein-test-actually-tells-you.
Chicago
Ph.D., Patrick Freeze,. "What an ACE Protein Test Actually Tells You (and What It Doesn't)." Soil Health Exchange. Published 2026-05-05. https://soilhealthexchange.com/blog/what-an-ace-protein-test-actually-tells-you.
Citation metadata is provided for discovery tools and reference managers. Inclusion in external scholarly indexes is not guaranteed.
Discussion (1)
JA
Joseph Amsili2 months ago
My recent paper: "Pedotransfer functions for soil protein based on Random Forest Modeling..." provides some nice insights using a dataset of 4,171 soil samples that had been run through the Cornell Soil Health Laboratory: https://www.tandfonline.com/…2025.2454015


My recent paper: "Pedotransfer functions for soil protein based on Random Forest Modeling..." provides some nice insights using a dataset of 4,171 soil samples that had been run through the Cornell Soil Health Laboratory: https://www.tandfonline.com/…2025.2454015