What Makes Cover Crops Work? Lessons from 657 Farmers
Cover-crop decisions rarely stay at a simple yes or no. Here is what 657 farmers said about where the practice fits, where it does not, and what they watch before trying again.
Editor's Note
An independent Soil Health Exchange analysis of the 2026 National Cover Crop Survey. CTIC, SARE, ASTA, and the survey sponsors did not pay for, commission, or review this article.
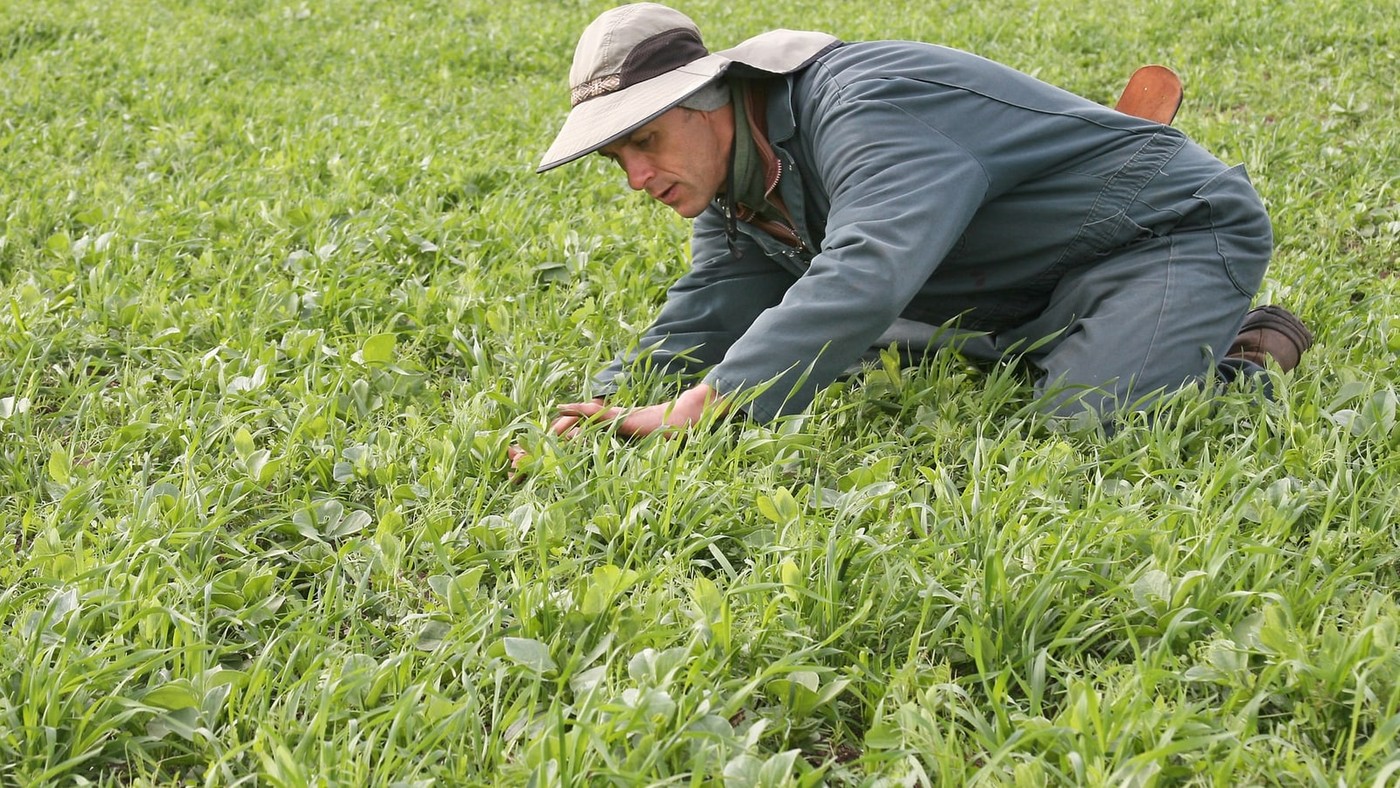
A cover crop is not one fixed practice. Species, planting window, end use, and the crop that follows all shape whether it fits a field in a given year. — Credit: Jim Leap, USDA Agricultural Research Service
Quick reader poll
Which best describes your cover-crop use?
Choose the answer closest to your farm. This is an informal reader pulse, not a representative survey.
One response per browser. No name or email is collected.
The bottom line
The 657 submissions provide a detailed snapshot of engaged farmers rather than a single verdict on cover crops. Question-level sample sizes vary because respondents could skip items and incomplete surveys were retained when answers were usable. Within this group, cover-crop acres kept growing, mixtures were common, cereal rye dominated reported species acreage, yield differences were modest, and weather, timing, grazing, weed control, and economics shaped field-level decisions.
The most useful finding in the 2026 National Cover Crop Survey appears before any yield chart: cover crops are not a permanent yes-or-no identity. Farmers make the decision again for each field and season. A late harvest can close the planting window. A dry forecast can make a living cover feel too costly in water. Grazing can turn biomass into feed. A good rye stand can change the weed-control calculation. [1][1]
So the headline number—657 participating farmers—is only the beginning. Of the 653 people who answered the use question, 68% planted cover crops every year, 16.4% used them in some years, 8% had used them previously, and 7.7% had never used them. Even among farmers currently planting cover crops, 60.8% said there were years when they left some fields without a cover crop. [1][1]
Click to expand
Figure
Cover-crop use among survey respondents
Use every year
68 %
Use in some years
16.4 %
Used previously
8 %
Never used
7.7 %
Responses to the cover-crop-use question. n=653. Percentages total 100.1% because of rounding. Source: 2026 National Cover Crop Survey, p. 18.
Who answered—and why the sample size changes
The online survey ran from March 12 through April 4, 2026 and received 657 submissions from farmers in 46 states and Puerto Rico. Of those, 533 were complete and 120 were incomplete. The research team retained usable answers from both groups rather than discarding an entire response when only some questions were skipped. [1][1]
That design explains the changing denominators. The report begins with 657 total submissions, uses n=655 for the farm-type profile, n=653 for the cover-crop-use and total-acreage questions, n=645 for age, n=640 for crops grown, and n=633 for location. These are not competing totals; each n is the number of usable answers for that question. The most reliable way to read any percentage in the report is together with the sample size printed beside it. [1][1]
Figure
How respondents described their farms
n=655
Commodity37.7%
Commodity + livestock23.4%
Specialty18.8%
Livestock9%
Specialty + livestock5.7%
Commodity + specialty2.8%
Commodity + specialty + livestock2.6%
Mutually exclusive combinations selected for the farm-type profile. n=655 as reported. Percentages total 100%. Source: 2026 National Cover Crop Survey, p. 10.
Click to expand
The respondent pool crossed several kinds of agriculture. About two-thirds included commodity crops in their farm description, while specialty-crop and livestock operations were also well represented. That mix is useful because the value of a cover crop can show up differently—as row-crop residue and nutrient capture, vegetable-system rotation, livestock feed, or some combination of those jobs. [1][1]
The survey was promoted through the organizers’ contact lists, agricultural media, associations, press releases, and social media. The resulting group leaned Midwestern and was more conservation-oriented than the general farm population: 44.4% reported continuous no-till, while 45.9% reported rotational no-till, reduced tillage, strip-till, or vertical tillage. That respondent profile is part of the context for interpreting the experience reported here. [1][1]
How to read the evidence
The yield, weed-control, moisture, and profit figures are farmer-reported comparisons. They capture the experience of the respondents, but they do not isolate the effect of cover crops from soils, weather, rotation, fertility, planting date, termination, or management skill. The report is strongest as a description of this respondent group and the decisions they faced; national prevalence and causal effects require different study designs.
Editorially, the percentages are most useful as prompts for a field decision: Which benefits matter here? Which constraints are likely to decide the outcome? What would we measure before expanding the practice?
Experienced farmers were expanding their cover-crop acres
Nearly half of the farmers who answered the experience question had planted cover crops for at least 10 years. Within this experienced and self-selected group, average cover-crop acreage rose from 313 acres in 2021 to 397 acres in 2025. Respondents anticipated an average of 416 acres in fall 2026. [1][1]
Figure
Average cover-crop acres reported by farmers
313 acres2021
338 acres2022
359 acres2023
377 acres2024
397 acres2025
416 acres2026 anticipated
The number answering varied by year: 2021 n=413; 2022 n=424; 2023 n=479; 2024 n=451; 2025 n=470; anticipated 2026 n=466. This is growth within the respondent group, not a national acreage estimate. Source: 2026 National Cover Crop Survey, p. 19.
Click to expand
The rise from 313 to 416 acres describes expansion within this respondent group. Its value is not as a national acreage estimate, but as evidence that many experienced farmers were scaling the practice when it fit their operations.
Mixtures were mainstream, but cereal rye dominated the acreage
Among 489 farmers currently planting cover crops who answered the mix question, 25.9% planted only single-species covers, 32.3% planted only mixes, and 41.7% used both approaches in different situations. Put another way, 74% used a mixture at least sometimes. The report also found a practical seasonal distinction: cool-season mixes generally contained two or three species, while warm-season mixes often contained four or more. [1][1]
Cereal rye remained the workhorse. Among 439 farmers reporting species acres for fall 2025, rye appeared on 110,778 acres—more than three times the 33,042 acres reported for radishes. Oats, rapeseed or canola, turnips, winter wheat, crimson clover, and hairy vetch formed the next tier. [1][1]
Figure
Most-used cover crop species by reported 2025 acres
Cereal rye
110,778 acres
Radishes
33,042 acres
Oats
24,068 acres
Rapeseed/canola
23,722 acres
Turnips
22,699 acres
Winter wheat
21,730 acres
Crimson clover
17,361 acres
Hairy vetch
15,508 acres
Top eight species among farmers reporting species acreage. n=439. Species within a mix are each credited with the mix acreage, so these bars describe species use and should not be summed as unique physical acres. Source: 2026 National Cover Crop Survey, pp. 20–21.
Click to expand
Take-home message
The practice described here was flexible: a single species on one field, a mix on another, more acres over time, but not every field every year. Cereal rye was the dominant workhorse, while mixtures let farmers combine jobs or adapt to a different planting window. That is a more useful picture than treating cover crops as one uniform practice.
Reported yield gains were positive, but small
Farmers compared 2025 cash-crop yields on similar land with and without a cover crop in 2024. Corn respondents reported a mean of 200 bushels per acre after a cover crop and 196.5 without one—a 3.5-bushel or 1.8% difference. Soybean respondents reported 59.84 bushels after covers and 58.44 without, a 1.4-bushel or 2.4% difference. [1][1]
Figure
Reported mean yield advantage after cover crops
Corn
1.8 %
Soybean
2.4 %
Wheat
3.9 %
Farmer-reported mean differences on similar acreage. Corn n=110; soybean n=126; wheat n=16. The wheat result is especially uncertain because of its small sample. Source: 2026 National Cover Crop Survey, pp. 58–60.
Click to expand
What sat behind the yield percentages
Cash crop
Without prior cover
After prior cover
Reported difference
Sample
Corn
196.5 bu/ac mean
200.0 bu/ac mean
+3.5 bu/ac; +1.8%
n=110
Soybean
58.44 bu/ac mean
59.84 bu/ac mean
+1.4 bu/ac; +2.4%
n=126
Wheat
72.56 bu/ac mean
75.38 bu/ac mean
+2.82 bu/ac; +3.9%
n=16
Source: 2026 National Cover Crop Survey, pp. 58–60. These are reported comparisons, not randomized trials.
The medians make the scale even clearer. Median corn yield was about two bushels higher after covers, median soybean yield was effectively unchanged at 60 bushels per acre, and median wheat yield differed by one bushel. If a cover crop has to earn its place, do not build the whole case around an assumed yield bump.
Some of the clearest benefits appeared outside the yield monitor
Planting green—seeding the cash crop into an actively growing cover—was reported by 47.1% of the 463 farmers currently planting cover crops who answered that question. Among 208 planting-green respondents asked for their three most notable impacts, 87% selected better weed control and 3.4% selected worse weed control. The same question found both improved and reduced nitrogen availability, plus both higher and lower pest pressure, which is a reminder that the practice changes a system rather than producing one universal response. [1][1]
47.1%
Planted green; n=463
87%
Better weed control among planting-green respondents; n=208
31.2%
Reported herbicide-cost savings after covers; n=456
56.9%
Said planting green helped midseason moisture; n=211
The herbicide-cost result needs its full context. While 31.2% reported savings, 28.5% reported no change and 33.8% could not make a comparison. Only a small share reported higher costs. If you are testing this on your farm, track treatment and cost on paired fields—not only whether one field looked cleaner.
Why a farmer may skip a field—or an entire season
Of 467 farmers currently planting cover crops who answered the question, 284 said there were years when they did not plant covers on some fields. That does not necessarily mean they were abandoning the practice. It may sound familiar: Did harvest finish early enough? Was the soil too dry or too wet? Was labor available? Did the rotation leave a workable window? [1][1]
Figure
Why farmers left some fields without covers in some years
Cash crop harvested too late
43.9 %
Do not cover every acre
41.8 %
Too dry or too wet
38.6 %
Not enough time or labor
37.9 %
Not used ahead of certain crops
30 %
Rotation limits use
27.5 %
Seed cost
25.4 %
Respondents could select multiple reasons. n=280 farmers who sometimes left fields without covers. Source: 2026 National Cover Crop Survey, pp. 32–33.
Click to expand
A separate challenges question pointed in the same direction. Weather led at 57%, followed by timing conflicts at 42.4%, stand establishment at 38.2%, and unfavorable economics at 28% among 453 respondents. Those are management and fit constraints, not simply attitude.
Partial use can be rational management
A field skipped after a late harvest is different from a practice rejected on principle. Measure adoption by where a cover crop fits, what job it performs, and whether the farmer returns to it—not only by whether every acre was planted every year.
Grazing changed the economic equation—but many could not price it
About 35% of 446 farmers currently planting cover crops reported grazing, harvesting the crop for forage, or doing both. Among 136 graziers, 84.6% selected lower feed costs as a benefit, 70.6% selected improved soil health, and 47.1% selected improved livestock performance. [1][1]
Figure
Reported net-profit effect of grazing cover crops
Profit gain
44.5 %
No impact
11.7 %
Profit reduction
1.5 %
Unable to quantify
42.3 %
Calculated from the report’s counts for all respondents (n=137): 61 reported a gain, 16 no impact, 2 a reduction, and 58 were unsure. Source: 2026 National Cover Crop Survey, p. 54.
Click to expand
The report emphasizes that 77% of respondents who could quantify the result reported a gain: 61 of the 79 who chose gain, no impact, or reduction. But 42.3% of the full group was unsure. Both numbers matter. Grazing may create one of the clearest routes to near-term value, while fencing, water, labor, and incomplete records make that value hard to measure.
Infrastructure is the constraint behind the opportunity. Among farmers who used cover crops without grazing them and were interested or maybe interested in grazing, 81.6% said they would need fencing and 58.9% said they would need water infrastructure.
Incentives may be buying farmers time to learn
In 2025, 56.3% of 439 farmers currently planting cover crops received at least one incentive payment; respondents could name more than one program. Of 256 payment recipients, 57% said they definitely planned to continue cover crops after payments ended and 24.6% said they probably would. None selected “definitely no.” [1][1]
Figure
Intent to continue after incentive payments end
Definitely continue
57 %
Probably continue
24.6 %
Undecided
13.7 %
Probably not
4.7 %
Definitely not
0 %
Farmers currently planting cover crops who reported receiving an incentive payment. n=256. Source: 2026 National Cover Crop Survey, p. 70.
Click to expand
This is an intention, not a measured retention rate, and the survey cannot prove that payments caused continued use. Still, it supports a practical program-design idea: give farmers enough seasons to learn establishment and termination, observe benefits, and adapt the practice. The report recommends at least three years, flexible rules, and a smoother enrollment process.
Responses from farmers who had stopped planting cover crops add context. Only 21.6% of the 51 farmers in this group had ever received an incentive. All 10 who answered the follow-up said nothing about the incentive program caused them to stop. Their leading reasons were cash-crop yield concerns, unfavorable economics, weather, timing, and stand establishment.
Most farmers who had never planted cover crops were open to trying them
The sample of farmers who had never planted cover crops was small, but it points toward a reachable group. Of 49 respondents who had never planted a cover crop, 18.4% said they would definitely consider trying one, 20.4% said probably, and 34.7% said maybe. Together, 73.5% were at least open to the idea. [1][1]
Figure
Would farmers who had never planted cover crops consider trying them?
Definitely yes
18.4 %
Probably yes
20.4 %
Maybe
34.7 %
Probably not
18.4 %
Definitely not
8.2 %
Respondents who reported never using cover crops. n=49. Source: 2026 National Cover Crop Survey, p. 79.
Click to expand
Their highest-ranked concerns were no measurable economic return, the time and labor required, and possible yield loss in the following cash crop. In a separate question, 40 farmers who had never planted cover crops gave a median required incentive of $72.50 per acre to motivate a trial. The mean was $115.48 because a few very large answers pulled it upward. With such a small and diverse group, $72.50 should not become a national payment recommendation; it is a signal that perceived first-year risk is substantial.
Before you seed: six questions for the field
This report becomes most useful when you turn its categories into pre-plant questions. The goal is not to force a cover crop onto every field. It is to make the decision clear enough that you can repeat what worked—and diagnose what did not.
A field-level cover-crop fit check
Decision
Signal from the survey
What to settle before seeding
Can it establish?
Late harvest, weather, and poor stands drove many skipped acres
Realistic planting date, species, method, seed-to-soil contact, and fallback if the window closes
What job pays first?
Average yield gains were modest; weed control and forage created clearer near-term value for some
Primary goal, expected cost saving or revenue, and the record needed to verify it
What crop follows?
Results varied with rotation, moisture, nitrogen, and planting-green management
Feed savings were common, but fencing and water limited grazing
Animals, stocking plan, water, fencing, labor, pesticide restrictions, and how value will be recorded
Does cost share fit?
Most recipients intended to continue, while farmers who had never used cover crops wanted first-year risk reduced
Eligibility before planting, contract length, management flexibility, payment timing, and the post-payment plan
What would make us pause?
Intermittent use was common and often operational
A written no-plant threshold for date, moisture, labor, seed cost, or the following crop
Use local Extension, NRCS, crop-insurance, and pesticide-label guidance to turn these questions into a field plan.
If you are trying cover crops, start with one job and one fair comparison. Record the planting date, seed and application cost, stand, termination, field operations, cash-crop yield, herbicide and fertility changes, and any forage value. Compare it with a genuinely similar field or strip. One season may reveal an establishment problem; several seasons are usually needed to judge resilience, soil change, and management learning.
Build the plan around the field
The Soil Health Exchange Cover Crop Lab can compare species and mixtures by location, planting window, rotation, goal, and termination preference. Use it to create a starting plan, then confirm rates, dates, herbicide restrictions, insurance rules, and termination guidance locally.
The survey does not settle whether cover crops pay everywhere. It offers something more useful: a clearer picture of the conditions under which farmers expand them, pause them, graze them, plant into them, or consider trying again.
That changes the conversation from a label to a management process. Instead of stopping at, “Do you use cover crops?” ask: On which field? After which crop? Planted when, for what job, with what exit plan—and measured against what outcome?
SH
Written by
Soil Health Exchange
Soil Health Exchange connects soil science, field experience, and practical decision-making through independent, accessible resources.
#Cover Crops#2026 National Cover Crop Survey#Planting Green#Cover Crop Economics#Cover Crop Grazing#Weed Control#Conservation Incentives#Soil Health
Scholarly record
References & Citation
Source material for every claim in this article, plus a citation-ready record for reference managers and scholarly indexes.
Exchange, S. H. (2026). What Makes Cover Crops Work? Lessons from 657 Farmers. Soil Health Exchange. https://soilhealthexchange.com/blog/cover-crops-arent-an-on-off-switch-2026-survey
More citation formats
MLA
Exchange, Soil Health. "What Makes Cover Crops Work? Lessons from 657 Farmers." Soil Health Exchange, 2026-09-04, https://soilhealthexchange.com/blog/cover-crops-arent-an-on-off-switch-2026-survey.
Chicago
Exchange, Soil Health. "What Makes Cover Crops Work? Lessons from 657 Farmers." Soil Health Exchange. Published 2026-09-04. https://soilhealthexchange.com/blog/cover-crops-arent-an-on-off-switch-2026-survey.
Discussion
No comments yet. Be the first to share your thoughts!