The Soil Food Web: Who Is There, What They Do, and What Your Tests Can Actually See
An interactive, field-guided tour of soil organisms, the functions they can support, the conditions that shift the web, and what common biological tests measure.
SH
By Soil Health Exchange Team||10 min read|47 reads
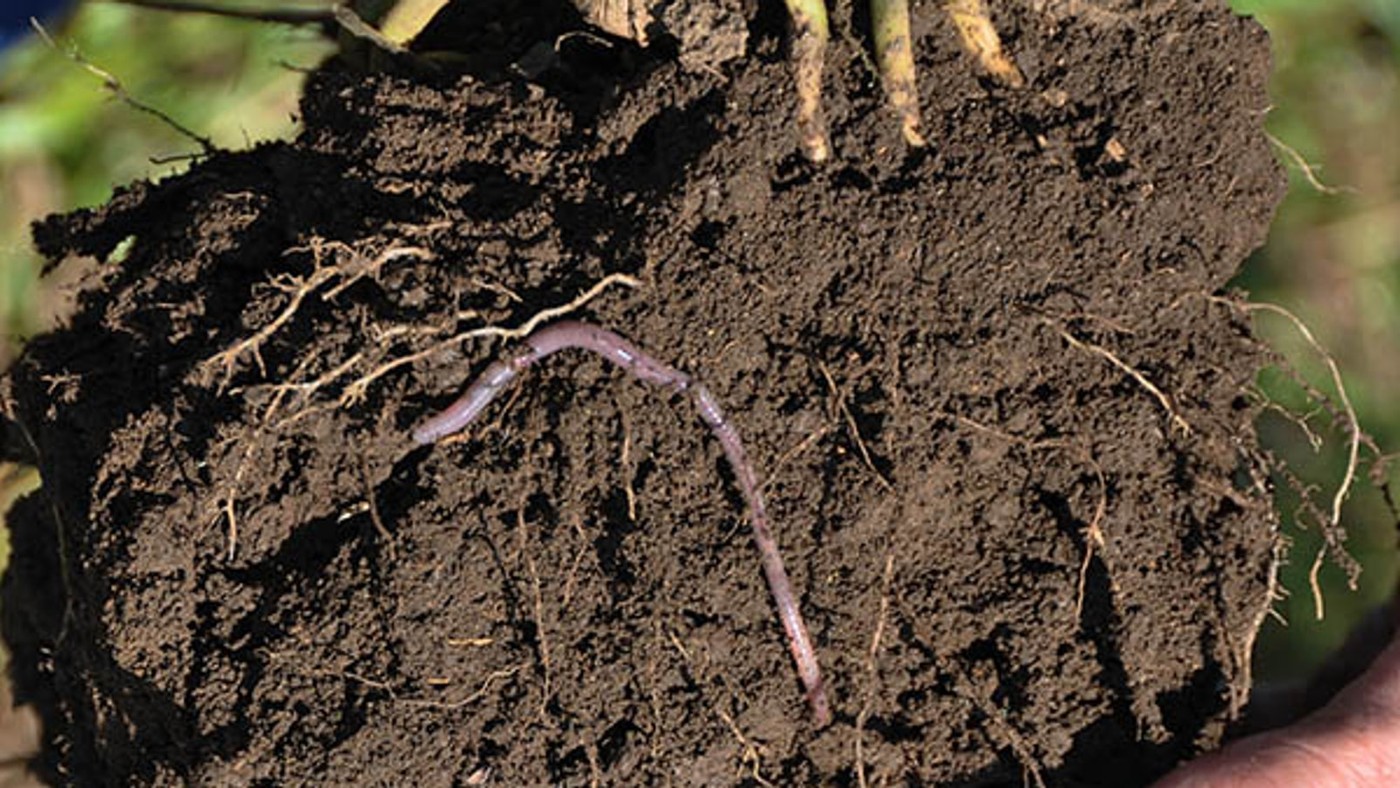
Living roots, soil aggregates, and an earthworm reveal the visible edge of a much larger food web; most of its organisms and exchanges remain too small to see. — Credit: USDA Natural Resources Conservation Service
The bottom line
The soil food web is a changing network shaped by living roots, residue, water, air, and management. Start with the field question, then choose a test that can actually see the organism, process, or pool you care about. No single test inventories the whole web, and finding an organism does not by itself prove that it is active or helping the crop. Pair the result with a representative sample, field observations, and a comparison that can guide the next decision.
A soil-food-web diagram can make the underground community look like a fixed ladder with plants at the bottom and predators at the top. In a field, it is a changing network. Living roots, dead roots, residue, microbes, grazers, engineers, predators, water, air, minerals, and management keep rearranging the pathways. USDA NRCS describes the web as organisms connected by what they consume and by the products they release. Broader ecological reviews show that belowground diversity supports multiple processes whose outcomes depend on field conditions. [1][3]
Start with what you are seeing or trying to decide. Is residue breaking down slowly? Are you worried about a plant-parasitic nematode, curious about a change after reduced tillage, or trying to understand an unfamiliar laboratory result? Each question needs different evidence. Use the explorer below to trace connections, open an organism group, change a field condition, and compare measurement methods.
Interactive field guide
Explore the soil food web—from organisms to evidence
Soil is a network, not a ladder. Trace the connections, open an organism group, test a field condition, or choose a measurement approach.
Follow each arrow from a resource or prey toward the organism that uses it. Select any group to isolate its direct pathways.
Carbon or food resource
Microbial or fungal grazing
Predation
Two-way plant–fungal exchange
Teaching map: these are common pathways, not a complete census or a claim that every species uses every connection. Arrow direction shows resource or prey → consumer; it does not show abundance, flow rate, or crop benefit.
Teaching model: connections show common energy, feeding and habitat relationships—not exact abundance, a universal healthy community, or a fertilizer recommendation. Use the article sources and a purpose-built sampling design for field decisions.
1. Follow the carbon before counting organisms
Most food-web stories begin with carbon captured by plants. Living roots release some of that carbon into the —through exudates, sloughed cells, dead roots, and exchanges with symbiotic organisms. Crop residue supplies another kind of food. Its chemistry, size, placement, soil contact, and moisture help determine which organisms can use it and how quickly.
rhizosphere—the narrow zone of soil influenced by roots
Before interpreting a biological test, record the crop and growth stage, living-root duration, residue amount and placement, soil moisture and temperature, recent rain, tillage, manure or amendments, pesticide applications, drainage, and sampling depth. A result without this context may describe the sample but fail to explain the field.
Bacteria and residue-feeding fungi do different jobs
Bacteria and saprotrophic fungi—fungi that feed on dead material—both use carbon from roots, dead cells, and residue, but they access and process it in different ways. Fungal threads, called hyphae, can grow through soil pores and release enzymes outside the cell. Bacteria are not one functional group; different species use different foods and perform very different jobs. Both groups can contribute to decomposition, nutrient transformations, aggregation, plant partnerships, or disease, so the labels “bacteria” and “fungi” alone do not tell you whether a soil is healthy. [1][3]
Mycorrhizal fungi: partnership requires a living, compatible host
Mycorrhizal fungi receive carbon from a compatible living plant and extend the volume of soil explored beyond the root surface. A positive result can mean several different things: the fungus may be present in soil, colonizing roots, producing viable propagules, or contributing biomass. None of those measurements automatically proves nutrient transfer or crop response. Crop compatibility, fertility, soil conditions, weather, and the resident fungal community all shape the partnership, so choose the method that matches the question.
For method choices, compare AMF measurement approaches and the distinction between NLFA and PLFA. The first helps separate colonization, propagules, DNA, and lipid evidence; the second explains why neutral and phospholipid fractions do not represent the same pool.
2. Meet the grazers, transformers, engineers, and predators
Protists and microbial-feeding nematodes move nutrients through the microbial loop
Many protists—mostly single-celled organisms—and several nematode groups feed on microbes. A grazer and its prey do not need nutrients in the same proportions, so grazing can release some nutrients held in microbial cells and change competition around the root. Experiments have shown that bacterial-feeding nematodes can increase plant nutrient uptake under some carbon- and nitrogen-rich conditions, but the response still depends on the organisms, crop, and field conditions. [5]
Nematode feeding groups and diagnostic indices
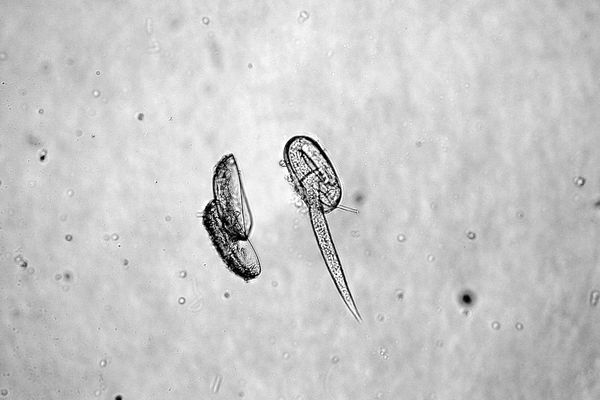
Nematodes include bacterial-feeders, fungal-feeders, plant-feeders, predators, and omnivores. These feeding guilds—groups defined by what and how they eat—allow a trained laboratory to describe the community and calculate diagnostic indices. Ferris and colleagues developed one widely used framework for interpreting enrichment and food-web structure from guild-level data. A total count cannot distinguish plant-feeding nematodes from microbial-feeders, predators, or omnivores. [4]
Microarthropods, earthworms, and larger fauna reshape the habitat
Mites, springtails, insect larvae, earthworms, and other soil animals fragment residue, graze microbes, move organic particles, create pores, mix soil, and become food for predators. Those activities can affect water flow, aggregation, aeration, and the surfaces available to microbes. A field count is only meaningful alongside the collection method, season, soil moisture, climate, texture, acidity, disturbance, crop, and species involved. [9][11]
3. Connect food-web measurements to field functions
From field question to evidence
Field question
Begin with
Possible measurement
Unsupported inference
Why is residue persisting?
Residue chemistry, contact, moisture, temperature, nitrogen context and placement
Repeated residue cover or mass, respiration under defined conditions, selected enzyme assays
That one microbial group caused the rate
Did a management change alter microbial biomass?
Paired or repeated samples with the same season, depth and handling
PLFA or another validated biomass method
That higher biomass guarantees better yield
Is a nematode problem likely?
Roots, symptoms, crop history and a representative sample
Crop-appropriate plant-parasitic nematode assay
That total nematodes equal pest pressure
Are mycorrhizal fungi involved?
Host compatibility, roots, fertility and the exact decision
Colonization microscopy, propagule bioassay, targeted DNA or AMF-associated lipids
That detection proves nutrient transfer
Is the system becoming more resilient?
A defined stress, field outcome and repeated comparison
A suite spanning physical, chemical and biological indicators
That one food-web ratio measures resilience
The measurement should be close enough to the decision that a different result would lead to a different next step.
No single organism owns a soil function. Decomposition, for example, depends on organisms finding suitable food under workable moisture, temperature, pore, and nutrient conditions. Aggregation can involve roots, fungal hyphae, microbial products, soil animals, clay, carbonates, wetting and drying, and tillage. Predators and competitors may contribute to pest suppression, but the outcome still depends on the pest, crop, timing, and habitat. Belowground diversity matters, but its effect on a particular field outcome depends on the conditions around it. [3]
Interpret groups within their field context
Read bacteria, fungi, and their ratio within the test method, sampling conditions, soil, and crop. A fungi:bacteria value combines broad groups; it cannot tell you whether those organisms are active, helpful, harmful, or important to the crop growing now.
4. Let field conditions explain why the web moves
Use the explorer’s Change conditions tab to ask what might move first. More days with living roots may extend the supply of carbon around roots. Surface residue changes both food and habitat near the soil surface. Disturbance can break fungal threads and aggregates while exposing fresh material. Drought shrinks the water films organisms use; rewetting can trigger a short respiration pulse. Saturation changes oxygen availability. Treat each direction as a hypothesis to check with field observations or measurements, not as a guaranteed response. [1][9]
Name the management change precisely: implement, depth, date, rate, crop, product, and duration.
Write the pathway you expect: for example, more days of living roots → longer carbon input → a possible shift in rhizosphere biomass or activity.
Choose one field observation and one fit-for-purpose measurement that could challenge that expectation.
Keep a comparison: a baseline, paired strip, reference zone, or repeat sample collected with the same method.
Record crop and soil outcomes. A biological shift matters to the decision only when its relationship to the desired function is supported.
5. Understand what common tests can actually see
PLFA and NLFA measure lipid pools
PLFA uses selected membrane-lipid markers to estimate living microbial biomass and broad groups. NLFA measures neutral lipids, which represent different storage pools and are sometimes used for questions such as AMF-associated biomass. Neither method provides a precise list of species. Marker choice, extraction, soil fraction, units, handling, and interpretation all matter, especially when comparing reports from different laboratories. [6] The PLFA field guide explains those boundaries in more detail.
DNA, qPCR, and sequencing: identity evidence with method boundaries
DNA methods range from targeted qPCR for a selected organism or gene to broader sequencing profiles. They can help answer who or what genetic potential is present, but the result depends on sampling, extraction, primers, reference databases, copy number, and reporting. Detection does not automatically show that an organism is alive, active, abundant, performing a function, or helping the crop. Add process or field evidence when the decision requires those answers.
Respiration, enzymes, and labile pools measure processes or pools
Respiration measures carbon dioxide produced under defined field or laboratory conditions. PMN, POX-C, ACE protein, and enzyme assays measure particular processes or pools defined by their methods; they do not identify every organism responsible. Soil Health Exchange’s guides to four-day CO₂ burst, PMN, POX-C, and ACE protein explain what each result can—and cannot—support.
A suite is stronger when every indicator has a job
A useful panel does not need every available test. A North American evaluation identified a minimum suite spanning physical, chemical, and biological indicators, and NRCS guidance similarly asks that the methods, soil, region, and interpretation fit the planning purpose. Give every indicator a clear job and connect it to a decision. [7][8]
6. Build a sampling comparison the web can answer
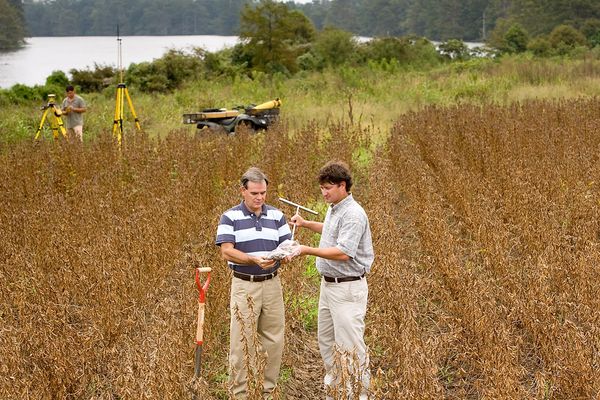
Soil biology can change over a few feet and with moisture, temperature, roots, residue, season, depth, and handling. Decide whether the sample represents a management zone, a problem area and its comparison, a treatment strip, or a repeat monitoring location. Then keep the depth, core pattern, timing, field condition, tools, storage, shipping, laboratory, and method consistent enough to make the comparison useful. [7][12]
For a visible problem, sample the affected area and a comparable area separately. For a management change, keep a baseline or paired treatment and repeat the same protocol. For an unfamiliar laboratory result, first identify what the method measured, then ask what comparison or calibration makes sense for your soil and decision.
7. Use this checklist before buying or interpreting a test
Write the field question in one sentence.
Choose the relevant organism, process, pool, or crop risk.
Record the food sources, habitat, moisture, temperature, crop stage, depth, and recent management.
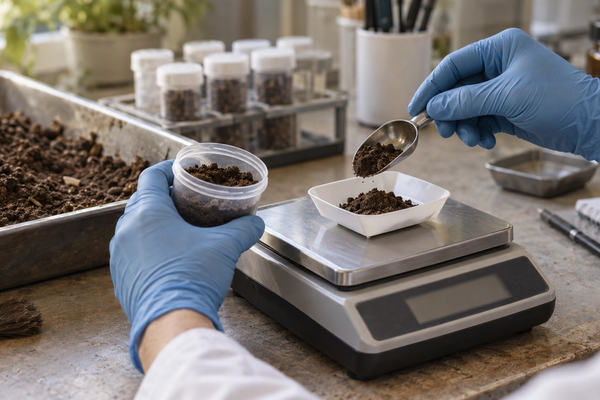
Ask the laboratory what the method directly measures, what units it reports, and how samples must be handled.
Confirm the comparison or calibration you will use before collecting.
Keep organism presence, biomass, activity, ecological function, and crop response as separate levels of evidence.
Decide in advance what result would change your next action.
When the result is surprising, repeat the context check before assigning a biological explanation.
Soil Health Exchange Team (2026). The Soil Food Web: Who Is There, What They Do, and What Your Tests Can Actually See. Soil Health Exchange. https://soilhealthexchange.com/blog/soil-food-web-organisms-functions-tests-interactive-guide
More citation formats
MLA
Soil Health Exchange Team. "The Soil Food Web: Who Is There, What They Do, and What Your Tests Can Actually See." Soil Health Exchange, 2026-09-01, https://soilhealthexchange.com/blog/soil-food-web-organisms-functions-tests-interactive-guide.
Chicago
Soil Health Exchange Team. "The Soil Food Web: Who Is There, What They Do, and What Your Tests Can Actually See." Soil Health Exchange. Published 2026-09-01. https://soilhealthexchange.com/blog/soil-food-web-organisms-functions-tests-interactive-guide.
Discussion
No comments yet. Be the first to share your thoughts!