Part 4 · Understanding & Interpreting Soil Health Indicators
Research Brief
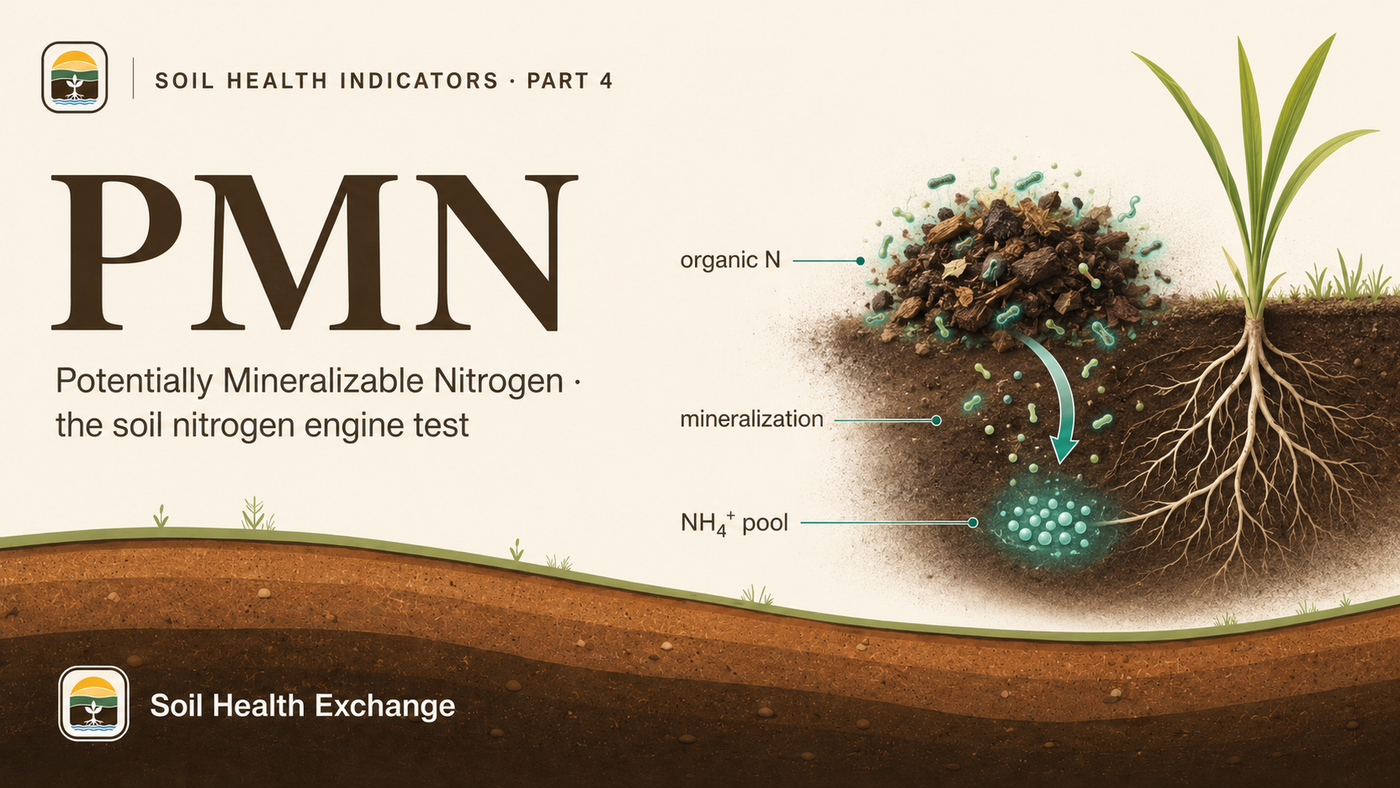
What Potentially Mineralizable Nitrogen (PMN) Tells You About Your Soil's Nitrogen Engine — and What It Won't
Part 4 of Understanding & Interpreting Soil Health Indicators: what Potentially Mineralizable Nitrogen (PMN) measures, the first-order mineralization kinetics behind it, how the lab runs the 7-day anaerobic incubation, how PMN compares to PSNT, ISNT, ACE protein, hot-KCl and the CO2 burst, how to sample and handle a fresh-soil-only test, what management moves it, and why it is a useful capacity index but a weak stand-alone fertilizer predictor.
Bottom line
PMN measures how much nitrogen your soil's microbes can release from the biologically active organic-N pool, read off the ammonium flush from a 7-day waterlogged incubation [1]. It indexes — in several datasets, though with region-dependent strength — the larger mineralizable-N pool (N0) that first-order kinetics describe [5][8], which makes it a reasonable index of N-cycling capacity. But it is a capacity number, not a delivery number: what your crop actually gets is a weather-driven in-season flux, and PMN measured under fixed lab conditions cannot pin that down [19][21]. The most direct levers that raise it are organic nutrient sources (manure and amendments), residue retention, and cover cropping [4][15][16]. No N-availability index — PMN included — has earned broad acceptance as a stand-alone fertilizer-rate predictor [5]; only the in-season nitrate test (PSNT) is regionally calibrated to a rate [24][25], and adding PMN to it improves corn N management only marginally [21]. Treat a rising PMN as confirmation that your organic-matter and microbial system is getting healthier, watched at one lab and one incubation temperature over years on fresh field-moist soil — not as a number you plug into a fertilizer equation.
What PMN actually measures
Potentially Mineralizable Nitrogen estimates your soil's capacity to release plant-available nitrogen from its biologically active organic-N pool [4][4]. The idea goes back to Waring and Bremner in 1964: incubate soil under waterlogged, oxygen-free conditions and the ammonium that accumulates is a usable index of nitrogen availability [1][1]. Under those anaerobic conditions, microbes keep mineralizing organic N into ammonium (NH4-N), but nitrification — the oxygen-dependent step that would convert it onward to nitrate — is strongly suppressed. So ammonium accumulates rather than being carried onward to nitrate (which would otherwise be subject to variable denitrification and leaching losses during incubation), and the amount it climbs over the incubation is your reading [1][1]. That deliberate use of anaerobic conditions is the test's central trick: with nitrification and leaching shut off and warmth and moisture standardized, the accumulated ammonium can be read directly as an index of the labile organic-N pool [23][23].
Mechanically, PMN is the increase in NH4-N: the value after incubation minus the value before it [3][3]. It's interpreted on a "more is better" basis as a proxy for the size of the readily decomposable organic-N pool and the soil's N-supplying capacity [4][4]. That framing — PMN as an indicator of the biologically active, labile fraction of soil organic N rather than the total N stock — is the conceptual basis the method has rested on since Drinkwater et al. laid it out [8][8]. The N comes mainly from microbial biomass and the decomposition of fresh residues, which is why it tracks biological activity rather than total soil N [7][7]. In plain terms, a higher PMN says your soil holds a larger, more active reserve of organic nitrogen that biology can turn loose for a crop.
The kinetics behind the number: capacity, pools, and rate
To use PMN well you have to understand what kind of quantity it is. Net N mineralization behaves, to a first approximation, as a first-order decay process: the rate at any moment is proportional to the size of the remaining mineralizable-N pool. Stanford and Smith captured this in 1972 with the now-standard equation Nt = N0(1 − e^(−kt)), where Nt is the cumulative N mineralized by time t, N0 is the *potentially mineralizable nitrogen* — the capacity, the total pool of organic N susceptible to release — and k is the rate constant [20][20]. Working across 39 widely differing soils incubated aerobically at an "optimum" 35 C for 30 weeks, periodically leaching out mineralized N, they found N0 ranged from about 20 to over 300 mg N/kg (roughly 5–40% of total soil N), and that a single rate constant fit most soils: k = 0.054 ± 0.009 per week, a half-life of about 12.8 weeks for mineralizing half of N0 [20][20].
This is the crucial conceptual split. N0 is a capacity; the in-season N a crop receives is a flux. Stanford's own stated goal was to measure N0 and *then* adjust it with climatic factors to estimate how much soil N would actually become available during a growing season [20][20]. PMN and N0 are both capacities — sizes of the mineralizable pool measured under fixed, standardized lab conditions. What the crop actually gets is the in-season *net* mineralization: N0 modulated by the real temperature and moisture trajectory of that field-season. A high PMN means a large potential supply, but the realized flux can be much lower in a cool, dry spring or higher in a warm, moist one. The routine 7-day anaerobic PMN test is a short proxy for the capacity, not a measurement of the season-long flux [7][7].
The 7-day anaerobic index is also not equal to N0 in absolute terms — it *underestimates* the full pool but rank-orders it. As reviewed in Schomberg et al., results from Chan (1997) put N0 at roughly 2.25 times the amount of N released during the anaerobic incubation, with a method-to-method correlation around r = 0.94 [5][5]. So the short test is a usable, fast stand-in for the capacity — requiring a multiplier of roughly 2.25× to recover an N0-scale estimate — and not a direct read of net seasonal mineralization.
Why the rate constant — and the incubation temperature — control the number
The rate constant k is strongly temperature-sensitive, conventionally described by a Q10 (the factor by which rate changes per 10 C). For temperate agricultural soils Q10 is about 2 — rate roughly doubles per 10 C of warming. A global meta-analysis of 379 studies found the Q10 of net N mineralization averaged 2.21 (range 1.03–11.89), varying across ecosystems from a grassland low near 1.67 to a forest high near 2.43, with a global mean net mineralization rate of 2.41 mg N/kg/day [22]. Because rate roughly doubles per 10 C, the chosen incubation temperature directly changes the measured PMN: a 40 C protocol accumulates substantially more ammonium over a fixed 7 days than a 30 C one, and Stanford and Smith's 35 C aerobic optimum sits between [20][22]. This is exactly why a PMN value is only meaningful against the temperature it was run at, and why the next box matters so much. Mineralization is also moisture-sensitive, peaking near 60% water-filled pore space; the anaerobic PMN test sidesteps that field-moisture variability by deliberately waterlogging the sample, standardizing one more axis away [22].
How the lab gets the number
The protocol is more involved than most chemical tests, which matters for both cost and comparability. In the Cornell CASH (CSH 08) procedure, two field-moist subsamples are run, kept at 4 C since collection [2][2][3][3]. One is extracted immediately with 2.0 M KCl, shaken an hour, separated (the CSH 08 SOP centrifuges the extract; the Framework Manual describes filtering — a small documentation discrepancy between the two Cornell sources), and read for baseline (Time-zero) ammonium [2][2][3][3]. The second gets 10 ml of water, has its headspace purged with N2 for about 45 seconds to drive out oxygen, is stoppered, and incubated waterlogged for exactly 7 days [3][3] — then extracted by adding 2.67 M KCl (a higher molarity chosen so that, combined with the 10 ml of incubation water, the final KCl concentration matches the 2.0 M baseline extraction), separated and read identically [2][2][3][3]. Both extracts are read colorimetrically (salicylate / nitroprusside / hypochlorite chemistry) on a continuous-flow autoanalyzer [3][3]. Cornell reports the result as micrograms of N per gram of dry soil: day-7 ammonium minus day-0 ammonium [3][3].
Incubation temperature is not standardized — and it's not a footnote
Warmer incubation means more mineralization (Q10 ~2, so rate roughly doubles per 10 C [22]), so the same soil can return different PMN numbers depending on the temperature used. The figures even disagree across Cornell's own documentation: the summary PMN description references a 7-day anaerobic incubation at 30 C, while the detailed CSH 08 step-by-step procedure specifies an incubator at 37 C for exactly seven days [3] — and because the 30 C summary framing and the 37 C step-by-step appear across the Framework Manual [2] and the CSH SOP [3], this is a discrepancy between the two Cornell sources, not necessarily a contradiction within a single file. (If you run this test, confirm with the Cornell Soil Health Lab which temperature their current production assay uses.) The Soil Health Institute / NAPESHM protocol used by Liptzin et al. runs the incubation at 40 C [4], attributed to the Bundy & Meisinger method [9], which is itself the 7-day, 40 C anaerobic procedure standardized by Keeney & Bremner (1966) [6] from the waterlogged-incubation concept that Waring & Bremner (1964) introduced [1]. So three different temperatures — 30, 37, and 40 C — are in active use across labs, and the Q10 sensitivity means a 40 C result will read higher than a 30 C one for the very same soil. Always confirm what temperature your lab used, pick one lab and one temperature, and never compare a 30 C result against a 40 C one as if they're the same measurement [4][22].
How to read the number
There's no single universal threshold, and the units you get back depend on how the lab reports. Two reference frames are useful. First, the underlying mineralizable-N pool that PMN is trying to index is wide. Across nine southern-US tillage-study soils, Schomberg et al. fit a first-order kinetic model two different ways, which is important to keep straight: the single-exponential best-fit pool (N0) ranged from about 35 to 488 mg N/kg with an average of 178, while a fixed-rate variant that forces the rate constant to k = 0.054 wk⁻¹ (N0*) averaged 183 mg N/kg [5][5] — and note that the fixed k is exactly Stanford and Smith's universal rate constant [20][20]. N0 and N0* are two estimators of the same underlying pool, not two different pools — they were "very close" within any one location [5][5]. A broadly similar window shows up elsewhere: Sharifi et al. reported N0 of 54 to 197 mg N/kg across 153 samples from field studies in New Brunswick, Quebec, Manitoba, and Saskatchewan, Canada, and Maine, USA [11][11] (as summarized in [5][5]). Second, Cornell sidesteps absolute thresholds entirely by converting your raw weekly flush into a 0–100 relative score against a texture-adjusted cumulative distribution, with five color classes from red (low) to dark green (high), all on a "higher is better" curve [2][2].
Interpreting PMN values
| What's being read | Low | High | Reference average | Units | Source |
|---|---|---|---|---|---|
| Potentially mineralizable N pool (N0, single-exponential fit), southern-US soils | 35 | 488 | 178 (N0 mean; fixed-rate N0* mean = 183) | mg N/kg soil | [5] |
| Cornell CASH PMN score (texture-adjusted relative percentile, higher-is-better) | 0 | 100 | 50 (scale midpoint, not a typical reading) | score (0–100) | [2] |
Reference ranges for the mineralizable-N pool that PMN indexes, and Cornell's relative scoring frame. Sources: Schomberg et al. 2009 [5]; Cornell CASH Framework Manual [2]. The two rows are different quantities (an absolute model-fit pool vs. a relative 0–100 score) and are not interchangeable. In row 1, the low/high (35–488 mg N/kg) and the average (178) are both from the single-exponential N0 fit; the fixed-rate N0* estimator of the same pool averaged 183. In row 2, the "50" is the literal midpoint of Cornell's 0–100 scale, not an empirically typical reading: the score is a texture-adjusted relative percentile, so a 50 means "middle of the reference distribution for your texture," not a fixed mg-N value.
Mineralizable-N pool (N0) ranges differ by region — and the pool is wide
Reported potentially-mineralizable-N pool (N0) endpoints from verified peer-reviewed datasets, showing how wide and region-dependent the absolute pool is. Stanford & Smith: 39 widely differing soils, aerobic 35 C incubation (1972 [20]). Southern-US: nine tillage-study soils, single-exponential N0 (Schomberg et al. 2009 [5]). Canada + Maine: 153 samples across field studies (Sharifi et al. 2007 [11], as summarized in [5]). These are absolute model-fit pools in mg N/kg, not directly comparable to Cornell's 0–100 relative score.
Why use the index at all? Because anaerobic N is one of several rapid measures that tracks the slower, more direct measure of the N-supply pool. In Schomberg et al.'s southern-US dataset, anaerobic N (Ana_N) was one of five of 13 indices strongly correlated with the N0 pool (r > 0.85) [5][5]. The literature that Schomberg reviewed reports even tighter relationships from earlier work — a 7-day anaerobic flush correlated with 84-day aerobic net mineralization at r = 0.96 and r = 0.94 in two earlier studies, both as cited in [5][5] — though Schomberg's own anaerobic-vs-mineralization correlation on the southern soils was more modest. Even so, Schomberg's overall conclusion is guarded: "no single N availability index has proven robust enough for broad acceptance" across a wide range of soils [5][5].
How PMN compares to other nitrogen tests
PMN is one of several soil N tests, and the most useful way to organize them is by one question: is the test *calibrated to an in-season fertilizer rate*, or is it a *capacity/diagnostic index* of N-supplying potential? Only one common test — the pre-sidedress nitrate test (PSNT) — is a true regionally calibrated rate tool. It measures actual soil nitrate (not organic capacity) on a 0–12 inch sample taken when corn is about 12 inches tall (V5, typically mid-June); above roughly 25 ppm NO3-N a corn yield response to more N is unlikely, and below it growers sidedress at a rate scaled to the deficit [24][24][25][25]. Penn State's modern recalibration for fields with a manure history (manure applied in 2 or more of the last 5 years) replaces a fixed threshold with a rate equation, (0.72 × yield goal in bu/ac) − (5.1 × PSNT NO3-N ppm), where the per-bushel coefficient dropped from 1.0 to 0.72 to reflect improved nitrogen use efficiency and the 5.1 term is the manure-credit factor; a 180 bu/ac goal at 15 ppm gives about a 53 lb N/ac sidedress [25][25]. PMN, by contrast, indexes capacity: it is "the most direct indicator of the capacity for nitrogen cycling," useful for benchmarking and trend, but not a rate recommendation [23][23]. The other capacity indices each read a different slice of the same organic-N machinery, and two of them (hot-KCl N and the CO2 burst) are simply faster chemical or respiration proxies for the slow PMN incubation.
Soil nitrogen tests compared: one calibrated rate test, several capacity indices
| Test | What it measures | Method (short) | Calibrated to a rate? | Source |
|---|---|---|---|---|
| PMN (anaerobic) | Capacity: labile organic-N pool / N-cycling capacity | NH4-N flush over a 7-day waterlogged incubation (30/37/40 C), 2 M KCl before vs after | No — capacity/diagnostic index | [3][23] |
| PSNT | Delivery: current soil nitrate at sidedress | NO3-N on 0–12 in sample at ~V5 corn; threshold ~25 ppm; rate equation | Yes — regionally calibrated in-season rate test | [24][25] |
| ISNT | Capacity: amino-sugar N (a mineralizable-N pool) | NaOH heating liberates (NH4 + amino-sugar)-N as NH3; acidimetric titration | Attempted; ~235 ppm critical value in Illinois but did not transfer to Iowa/Midwest | [26][27] |
| ACE protein | Capacity: the upstream organically-bound (protein) N reservoir | Autoclaved sodium-citrate extraction; BCA colorimetric assay | No — index of organic-N reservoir, ~$30/sample | [2][28] |
| Hot-KCl N | Capacity: hydrolyzable organic N (chemical proxy for PMN) | 2 M KCl at 100 C for ~4 h; hot-KCl NH4-N minus room-temp KCl NH4-N | No — correlative index, faster than incubation | [29] |
| 24-h CO2 burst (Solvita/Haney) | Capacity (indirect): microbial activity / mineralization potential via respiration | Rewet air-dried soil, measure CO2 flush over 24 h at ~70 F | No — respiration proxy; correlated with 28-d N min (R²=0.83) | [30] |
How PMN sits among common N tests. PSNT is the only routine, regionally calibrated in-season rate tool; PMN, ISNT, ACE protein, hot-KCl N, and the 24-h CO2 burst are capacity/diagnostic indices of N-supplying potential — correlated with mineralization to varying degrees but not, on their own, calibrated to a fertilizer rate. Sources: PMN [3][23]; PSNT [24][25]; ISNT [26][27]; ACE protein [2][28]; hot-KCl [29]; 24-h CO2 burst [30].
Three points are worth drawing out. First, ISNT is the cautionary tale: its Illinois calibration to corn N response (critical value around 235 ppm, rising with organic matter) could not be reproduced in Iowa or across the Midwest — across 43 Iowa on-farm trials there was no relationship between ISNT and either relative unfertilized yield or economic optimum N rate, so Iowa State advises against using it for rate decisions [26][26][27][27]. That failure to transfer is the rule for capacity indices, not the exception. Second, the 24-h CO2 burst is a carbon-respiration measure that infers N only indirectly, but the flush after rewetting dried soil was closely related to 28-day aerobic N mineralization (R² = 0.83) and water-extractable N (R² = 0.76) in the foundational Haney/Franzluebbers work, which is why it shows up in N-credit tools [30][30]. Third — and this connects to handling below — the CO2 burst is run on *air-dried, rewetted* soil, the exact treatment that ruins a PMN reading, because the burst is itself a rewetting-flush measurement. ACE soil protein (covered in Part 2) indexes the *size* of the readily mineralizable organic-N substrate pool, while PMN indexes how readily that pool releases N, so the two are best read together [28][28].
What management moves it
PMN responds to several of the practices that build biologically active organic matter, but not uniformly. In Liptzin et al.'s multi-site analysis, the suite of N indicators (including PMN) increased by 6%–39% overall in response to the bundle of decreasing tillage, cover cropping, retaining residue, and applying organic sources of nutrients [4][4]. Within that suite, however, PMN was the exception for reduced tillage — "all but PMN significantly increased in response to decreased tillage" — and PMN responded negatively to greater crop/rotation diversity [4][4]. So treat the broad 6%–39% band as a property of the indicator suite, not a guaranteed PMN-specific effect size; the practices that most consistently lift PMN — PMN itself was among the indicators that increased significantly for all three — are organic nutrient sources, residue retention, and cover cropping [4][4].
Of those levers, organic nutrient sources — manure and other amendments — are the most direct, because they add labile carbon and nitrogen that build microbial biomass, the proximate source of mineralizable N. In a controlled incubation of a loam soil, organic-inorganic amendments raised net cumulative N mineralized from a low of 39 mg N/kg (straw) to as much as 147 mg N/kg (a urea-N plus poultry-manure split), lifted soil total N by 12%–39% over the unamended control, and converted 21%–80% of the added organic N into plant-available N depending on amendment type [12][12]. The effect compounds over decades: a long-term subtropical study found that manure (alone or with fertilizer) markedly increased gross N mineralization relative to control and chemical-fertilizer treatments [14][14] — though note this is gross N mineralization, an internal isotope-pool-dilution turnover flux, not the net PMN flush, so it should not be read as a multiplier on PMN itself. The catch is that the short-term response is manure-type- and texture-specific — the rapidly-mineralizable pool (the first two weeks of release) was depleted by solid poultry manure in a sandy loam but increased by liquid dairy-cattle manure in a silty clay, even at the same available-N rate [13][13]. So "add manure" reliably builds the active N reserve over time, but the short-term PMN signal depends on which manure and which soil.
Organic amendments move the mineralizable-N pool (controlled incubation)
Net cumulative N mineralized in a controlled incubation of a loam soil: the low endpoint (straw treatment) versus the high endpoint (urea-N + poultry-manure split). These are incubation-based net-mineralization values, not the standard 7-day anaerobic PMN metric, but they index the same labile organic-N pool PMN reads and show the size of the organic-amendment uplift. Source: Abbasi & Khaliq 2016 [12].
Cover crops are the other biological lever, and they can raise PMN — but the response is variable across site-years, so read it as directionally helpful, not as a guaranteed jump. In a Florida sandy-soil citrus orchard, PMN was about 27% higher under a legume cover crop and up to about 67% higher under a legume + non-legume mixture than under the unmanaged control, though the mixture effect held only at some sampling times and the study's overall finding was minimal impact on most other bio-chemical soil-health indicators (PMN being a partial exception) [15][15]. In an Upper Midwest vegetable study, the cover-crop effect was inconsistent across site-years: PMN rose significantly after termination in every cover-crop treatment relative to no-cover in one perennial-history site-year (p < 0.001), yet in another site-year PMN fell roughly 50% post-termination, and the authors caution that "few clear trends were evident" across site-years [16][16]. Where the increase did appear, legume (hairy vetch, red clover), grass (cereal rye), and rye/vetch biculture treatments performed comparably, meaning the cover-vs-no-cover contrast mattered more than legume-vs-grass identity [16][16]. Species choice still matters for timing: low-C:N legume residue releases N quickly on termination, whereas high-C:N grass residue can transiently immobilize N before net mineralization begins [16][16].
Reported per-practice response ranges for N indicators (Liptzin et al. 2023)
Each bar is an actual reported endpoint (low or high) of the per-practice response range for the N-indicator suite, which includes PMN. Note PMN was non-significant for decreased tillage and responded negatively to greater crop/rotation diversity (not shown as a bundle endpoint). Source: Liptzin et al. 2023 [4], Section 3.2.
Reading the Liptzin practice chart honestly
These bars are the actual low and high endpoints of the per-practice ranges Liptzin et al. report for the N-indicator suite — not single point estimates and not PMN-specific effect sizes [4]. The 6%–39% figure quoted for the bundle is a suite-level response: it describes how the whole family of N indicators moved, with PMN being just one member. Cover cropping (12%–47%) and residue retention (13%–38%) straddle that 6%–39% bundle range; cover cropping's high end (47%) actually exceeds it. Critically, PMN itself did not respond significantly to decreased tillage and responded negatively to greater crop/rotation diversity [4], so the suite numbers are not transferable to PMN specifically, and they are not transferable per-field either — effect sizes in this literature are heterogeneous, dominated by site, soil texture, and climate rather than by a clean practice signal [4]. Do not read any single bar in this Liptzin chart as PMN's own number or as what you should expect on your ground. (This caveat governs the Liptzin per-practice chart above, not the separate organic-amendments incubation chart.)
Sampling and handling: PMN is a fresh-soil-only test
PMN is uniquely sensitive to how a sample is collected, stored, and pre-treated, because the measurement depends on a living, intact microbial community and on the labile organic-N pool — both altered by drying. This is why PMN must be run on fresh, field-moist, refrigerated soil and cannot be reliably measured on the air-dried soil used for routine chemical fertility tests. Cornell runs PMN (and the root bioassay) specifically on the fresh sub-sample, exempting it from the air-drying stream that the physical and chemical tests use, because air-drying would damage the biological measurement [3][3][23][23].
The reason drying destroys the signal is the drying-rewetting flush, the "Birch effect." When dry soil is rewetted, microbial cells lyse and previously protected organic matter is exposed, producing a burst of mineralized N and CO2. In Mediterranean soils, rewetting has been reported to produce large CO2 pulses relative to the air-dry baseline, with mineralization flushing in the hours after rewetting [32][32]. Because an anaerobic PMN incubation *is* a rewetting event, a sample that has been air-dried first carries an extra, artifactual flush superimposed on the true mineralization signal — modeling cumulative net N mineralized in dried-and-rewetted soil requires a two-pool model, a first-order flush layered on the zero-order background, and drying-rewetting significantly raises the background rate [31][31]. Wade et al. tested refrigeration, freezing, air-drying, and grinding on 7-day anaerobic PMN across contrasting textures: all four pre-treatments had distinct effects, with a soil-by-pretreatment interaction "driven by differences in field-moist versus air-dried pretreatments," and they concluded that standardization of handling is needed wherever consistent, comparable PMN values are required [33][33]. The practical takeaway: air-dried PMN values are not comparable to field-moist values, full stop.
How to sample for a valid reading
Because PMN reflects the live microbial and labile organic-N pool, the number is sensitive to how and when you sample — handle it carefully and the trend is meaningful; handle it sloppily and year-to-year comparisons fall apart. (1) Fresh and cold, never dried: collect field-moist soil, keep it out of direct sunlight, refrigerate at about 4 C (40 F) immediately on return from the field, and ship fast — with blue ice packs in hot weather. Cornell's rule is verbatim: "Do not freeze the samples. Do not dry the samples" [2][3]. Drying converts the test into a drying-rewetting flush measurement that is not comparable to field-moist PMN [31][32][33], and heat in the bag (a truck dashboard) degrades the biological signal [2][17]. (2) Depth: sample a consistent 0–6 inch slice — Cornell directs a uniform vertical slice 6 in deep and about 2 in thick at each of 5–10 stops, composited; biological and chemical indicators are significantly higher in the 0–6" surface than the 6–12" subsurface, where roots and organic matter concentrate [2][17]. (3) Timing/season: sample at field capacity, before field operations, at a consistent date around the same month each year to minimize seasonal variation — mineralizable N follows a strong seasonal cycle (it declined from spring to harvest and rose again into autumn across four cropping systems in Bonde & Rosswall) and shifts with sample timing, recent N fertilization, and incubation length, so the operative rule is consistency, not chasing the peak, and avoid sampling within a few months of a fertilizer application [2][17][18][34]. (4) One lab, one temperature: use the same lab every year, since handling, prep, incubation temperature, and analysis all differ between labs [17]. (One cross-reference, offered as interpretive context: ACE soil protein indexes the size of the readily mineralizable organic-N substrate pool, while PMN indexes how readily that pool releases N — read them together.)
Field calibration and using PMN as an N credit
Mineralization is not a rounding error in a crop's N budget. It contributes 20%–100% of total plant N needs depending on soil, previous crop, weather, and management, and extension synthesis puts the typical figure near half: baseline soil N mineralization usually supplies about half of crop N uptake, under a quarter on low-SOM soils and most of the crop's N on heavily manured or high-SOM soils [21][21][35][35]. Annually about 1%–3% of soil-organic-matter N is mineralized; a 3% SOM soil mineralizing at 2%/yr releases on the order of 100 lb N/acre [35][35]. So the N credit PMN is trying to flag is real and large — which is exactly why people want to plug it into a rate equation, and exactly why it matters that it doesn't work well as a stand-alone.
The strongest multi-site evidence is negative for stand-alone PMN. Clark et al. ran 49 corn N-response site-years across eight US Midwest states to test whether adding PMN to a pre-plant (PPNT) or pre-sidedress (PSNT) nitrate test improved prediction of yield, N uptake, and economic optimum N rate (EONR). The in-season PSNT beat the pre-plant PPNT (mean R² = 0.30 vs 0.19), but adding PMN and initial NH4-N improved prediction only marginally (R² gain ≤ 0.33; mean R² = 0.35), and only after heavy stratification by texture or growing-degree-days. Their explicit conclusion: "including PMN with PPNT or PSNT is not suggested as a tool to improve N fertilizer management in the U.S. Midwest" [21][21]. The mechanistic reasons are the three threads of this article: the capacity-vs-delivery gap (PMN measures potential, not the weather-modulated flux), PMN's own weather dependence (temperature and precipitation alone explained R² ≤ 0.20 and ≤ 0.18 of PMN variation; only adding soil C, SOM, and total N pushed predictability to R² ≤ 0.69 [10][10]), and supply-demand asynchrony — crop N uptake peaks in midseason then drops to near zero after flowering while mineralization continues, so synchronizing the two is structurally hard [35][35].
Where PMN *does* earn its keep on the rate question is regional, calibrated, and paired. In single-region calibrations it relates reasonably to corn response (R² = 0.33–0.74 to EONR, relative yield, and N uptake in the humid Southeast and Quebec, as cited in [21][21]). In Argentina the consistent success mode is pairing: using PMN to split soils into low- and high-mineralizable-N classes improved PSNT relative-yield prediction for the low-PMN group, and adding PMN to nitrate tests via multiple regression improved N diagnostics 5%–42% in wheat and corn (Sainz Rozas et al.; Reussi Calvo et al.; Orcellet et al., all as cited in [21][21]). The humid-temperate review literature agrees that no single mineralization index is universally reliable and that all of them require local calibration [19][19], and extension synthesis is blunt: most lab N-mineralization tests "are useful only as measures of relative changes in soil health" and "must be calibrated to accurately predict actual field N mineralization rates" [35][35]. So: PMN can sharpen an in-season nitrate test as a calibrated, region-specific diagnostic that flags low- vs high-supply soils — but even then the added precision is marginal, and it is never a stand-alone fertilizer-rate calculator.
What PMN cannot tell you
This is where decision-making has to stay disciplined. The most important limitation: no N-availability index, anaerobic PMN included, has earned broad acceptance as a robust field predictor [5][5]. The lab indices correlate with each other and with the N0 pool, but translating that into how much N your crop will actually get from the soil this season remains inconsistent in agricultural soils [5][5][19][19]. Part of the problem is that anaerobic PMN itself swings with soil and weather across a region: across eight US Midwestern states, soil and weather conditions drove much of the variation in anaerobic PMN, with even the strongest soil-property predictors (total C, organic matter, total N) explaining only a limited share (R² ≤ 0.40) [10][10]. As a stand-alone input to corn fertilizer decisions, adding PMN to a nitrate test gives only marginal improvement [21][21]. PMN tells you about capacity, not about a specific season's delivery under your weather.
- It's slow and finicky. PMN needs fresh, refrigerated field-moist soil (not air-dried), a 7-day incubation, N2 purging, and autoanalyzer ammonium determination — far more labor than rapid carbon-based proxies, and an exception to Cornell's otherwise air-dried sample stream because drying destroys mineralization potential [3][3][33][33].
- Cornell offers it only as an add-on. The standard CASH package uses soil-protein (ACE) and respiration; PMN is an add-on test [3][3], partly because of the fresh-soil and incubation burden [2][2].
- You may not need to measure it directly. N indicators are strongly tied to carbon indicators; Liptzin et al. report that in the NAPESHM dataset a 24-h C-mineralization test on its own predicted 56% of the variance in PMN, rising to about 70% when soil organic C or total N was added to the regression [4][4]. In other words, carbon mineralization is a usable stand-in for the N-supply signal [4][4].
- It measures capacity, not delivery. PMN is a lab capacity (N0-type) number measured under fixed temperature and moisture; the in-season N a crop receives is a weather-modulated flux, and the two can diverge widely in a cool/dry or warm/wet season [20][20][35][35].
- The scoring doesn't penalize "too high." Cornell's curve isn't calibrated to flag very high PMN [2][2]. Mechanistically — and this is inference, not a PMN-specific finding from the cited sources — very high mineralization potential combined with poor synchrony with crop uptake could in principle raise the risk of N losses to leaching, runoff, and denitrification; but any such loss risk depends on timing, weather, drainage, and crop demand, not on PMN level alone.
- Cross-lab numbers aren't comparable. Different incubation temperatures (30 C / 37 C / 40 C, with Q10 ~2) and pre-incubation handling mean two labs can return different values for the same soil [3][3][4][4][22][22][33][33].
Bottom line
Use PMN the way it earns its keep: as a biological barometer of N-cycling capacity that helps confirm whether your organic-matter management — less tillage, more cover, more residue, organic amendments — is building an active nitrogen reserve [4][4][2][2]. Remember what kind of number it is: a capacity (an N0-type pool), not the weather-driven in-season flux a crop actually receives [20][20][35][35]. Manure and cover crops are the most direct levers, building the mineralizable pool over time, though the short-term signal depends on manure type, soil texture, and cover-crop species, and the cover-crop response varies across site-years [12][12][13][13][15][15][16][16]. Watch the trend on your own fields, at one lab and one incubation temperature, sampled consistently on fresh field-moist soil that is never air-dried (see the sampling box above), over years [17][17][33][33]. Don't use it as a fertilizer-rate calculator; the field-prediction link isn't there yet, and only the in-season nitrate test (PSNT) is regionally calibrated to a rate [5][5][21][21][24][24][25][25]. If you're already measuring soil organic carbon and a carbon-mineralization burst, you may be capturing much of the same signal faster and cheaper [4][4]. For a short, producer-facing overview of the test and what it is used for, USDA-NRCS publishes a one-page PMN fact sheet [7][7].
Test Your Knowledge
Each attempt draws 8 questions from a 12-question pool and shuffles both the questions and answer choices. Score 85% or higher to earn a Certificate of Completion.
1.What does Potentially Mineralizable Nitrogen (PMN) fundamentally measure?
2.Why does ammonium accumulate rather than convert to nitrate during the anaerobic PMN incubation?
3.What is the key conceptual distinction the article draws between PMN (or N0) and the nitrogen a crop actually gets?
4.How should the 7-day anaerobic PMN result be related to the full potentially mineralizable N pool (N0)?
5.Why must PMN be run on fresh, field-moist, refrigerated soil rather than the air-dried soil used for routine chemical tests?
6.How does the Cornell CASH assessment report and score PMN results?
7.What did the continental multi-site analysis show about PMN responses to management?
8.What did Clark et al.'s 49-site-year Midwest study conclude about using PMN for corn nitrogen-rate decisions?
Written by
Soil Health Exchange Team
Scholarly record
References & Citation
Source material for every claim in this article, plus a citation-ready record for reference managers and scholarly indexes.
Cite this
Reference this work
Soil Health Exchange Team (2026). What Potentially Mineralizable Nitrogen (PMN) Tells You About Your Soil's Nitrogen Engine — and What It Won't. Soil Health Exchange. SHE-ART-2026-0015. https://soilhealthexchange.com/cite/SHE-ART-2026-0015
Soil Health Exchange assigns a stable identifier to every published answer and article. Citations keep working even if the URL changes later.
Sources (35)Show sources
- 1.Waring, S.A. & Bremner, J.M. (1964). Ammonium Production in Soil under Waterlogged Conditions as an Index of Nitrogen Availability. Nature 201(4922):951-952.
- 2.Moebius-Clune, B.N. et al. (2016). Comprehensive Assessment of Soil Health - The Cornell Framework Manual, Edition 3.2. Cornell University, Geneva, NY.
- 3.Cornell Soil Health Laboratory (2016). Comprehensive Assessment of Soil Health Standard Operating Procedures - CSH 08 Potentially Mineralizable Nitrogen (Add-on test) and CSH 01 Sample Intake and Processing.
- 4.Liptzin, D. et al. (2023). An evaluation of nitrogen indicators for soil health in long-term agricultural experiments. Soil Science Society of America Journal 87(4):868-884. DOI:10.1002/saj2.20558.
- 5.Schomberg, H.H. et al. (2009). Assessing Indices for Predicting Potential Nitrogen Mineralization in Soils under Different Management Systems. Soil Science Society of America Journal 73(5):1575-1586. DOI:10.2136/sssaj2008.0303.
- 6.Keeney, D.R. & Bremner, J.M. (1966). Comparison and Evaluation of Laboratory Methods of Obtaining an Index of Soil Nitrogen Availability. Agronomy Journal 58(5):498-503. DOI:10.2134/agronj1966.00021962005800050013x.
- 7.USDA-NRCS (2022). Soil Health - Potentially Mineralizable Nitrogen (PMN) technical note / fact sheet.
- 8.Drinkwater, L.E., Cambardella, C.A., Reeder, J.D., Rice, C.W. (1996). Potentially Mineralizable Nitrogen as an Indicator of Biologically Active Soil Nitrogen. In: Methods for Assessing Soil Quality, SSSA Special Publication 49, pp. 217-229.
- 9.Bundy, L.G. & Meisinger, J.J. (1994). Nitrogen Availability Indices. In: Methods of Soil Analysis, Part 2 - Microbiological and Biochemical Properties, SSSA, Madison, WI, pp. 951-984.
- 10.Clark, J.D., Fernandez, F.G., Camberato, J.J., Carter, P.R., et al. (2019). United States Midwest Soil and Weather Conditions Influence Anaerobic Potentially Mineralizable Nitrogen. Soil Science Society of America Journal 83(4):1137-1147. DOI:10.2136/sssaj2019.02.0047.
- 11.Sharifi, M., Zebarth, B.J., Burton, D.L., Grant, C.A., Cooper, J.M. (2007). Evaluation of some indices of potentially mineralizable nitrogen in soil. Soil Science Society of America Journal 71(4):1233-1239. DOI:10.2136/sssaj2006.0265.
- 12.Abbasi, M.K. & Khaliq, A. (2016). Nitrogen Mineralization of a Loam Soil Supplemented with Organic-Inorganic Amendments under Laboratory Incubation. Frontiers in Plant Science 7:1038. DOI:10.3389/fpls.2016.01038.
- 13.Thomas, B.W., Whalen, J.K., Sharifi, M., Chantigny, M., Zebarth, B.J. (2015). Mineralizable Nitrogen Responds Differently to Manure Type in Contrasting Soil Textures. Soil Science Society of America Journal 79(4):1396-1405. DOI:10.2136/sssaj2015.03.0124.
- 14.Wang, J. et al. (2023). Long-term manuring enhances soil gross nitrogen mineralization and ammonium immobilization in subtropical area. Agriculture, Ecosystems & Environment 348:108439. DOI:10.1016/j.agee.2023.108439.
- 15.Freidenreich, A., Dattamudi, S., Li, Y., Jayachandran, K. (2025). Cover crops enhance tree fruit production on sandy soils despite minimal impact on bio-chemical soil health indicators and fertility. Plant and Soil. DOI:10.1007/s11104-025-07968-5.
- 16.Perrone, S., Grossman, J., Liebman, A., Wells, S., Sooksa-nguan, T., Jordan, N. (2022). Legume Cover Crop Contributions to Ecological Nutrient Management in Upper Midwest Vegetable Systems. Frontiers in Sustainable Food Systems 6:712152. DOI:10.3389/fsufs.2022.712152.
- 17.Bandura, C., Elmquist, D., Hall, S., Ruark, M., Kampa, J. (2025). Soil Health Lab, Sampling, and Test Selection Considerations. University of Wisconsin-Madison Crops and Soils Extension (updated 25 July 2025).
- 18.Clark, J.D., Fernandez, F.G., Veum, K.S., Camberato, J.J., et al. (2020). Soil sample timing, nitrogen fertilization, and incubation length influence anaerobic potentially mineralizable nitrogen. Soil Science Society of America Journal 84(2):627-637. DOI:10.1002/saj2.20050.
- 19.St. Luce, M., Whalen, J.K., Ziadi, N., Zebarth, B.J. (2011). Nitrogen dynamics and indices to predict soil nitrogen supply in humid temperate soils. Advances in Agronomy 112:55-102. DOI:10.1016/B978-0-12-385538-1.00002-0.
- 20.Stanford, G. & Smith, S.J. (1972). Nitrogen Mineralization Potentials of Soils. Soil Science Society of America Journal 36(3):465-472. DOI:10.2136/sssaj1972.03615995003600030029x. (N0/k first-order model; 39 soils; k=0.054/wk; capacity-then-climate framing per Stanford 1987 Citation Classic.)
- 21.Clark, J.D., Fernandez, F.G., Veum, K.S., Camberato, J.J., et al. (2020). Soil-nitrogen, potentially mineralizable-nitrogen, and field condition information marginally improves corn nitrogen management. Agronomy Journal 112(5):4332-4343. DOI:10.1002/agj2.20335.
- 22.Liu, Y., Wang, C., He, N., Wen, X., Gao, Y., Li, S., Niu, S., Butterbach-Bahl, K., Luo, Y. & Yu, G. (2017). A global synthesis of the rate and temperature sensitivity of soil nitrogen mineralization: latitudinal patterns and mechanisms. Global Change Biology 23(1):455-464. (Q10 mean 2.21, range 1.03-11.89, ecosystem spread grassland ~1.67 to forest ~2.43; global mean net mineralization rate 2.41 mg N/kg/day.)
- 23.University of Wisconsin-Madison Extension, Crops and Soils. An Overview of Common Soil Health Indicators. (PMN as the most direct indicator of N-cycling capacity; 7-day anaerobic incubation; nitrification suppressed so NH4+ accumulates and is measured directly.)
- 24.University of Massachusetts Amherst Extension. Nitrogen Management: Pre-Sidedress Nitrate-N Test (PSNT) fact sheet. (25 ppm NO3-N critical threshold; 0-12 in depth; sampling at ~12 in corn height.)
- 25.Penn State Extension. Re-calibrating the Pre-Sidedress Soil Nitrate Test for Modern Corn Production. (Manure-history calibration: rate equation (0.72 x yield goal) - (5.1 x PSNT ppm), where 5.1 is the manure-credit factor; yield coefficient lowered from 1.0 to 0.72; V5/12-in timing; applies to fields with manure in 2+ of last 5 years.)
- 26.Cornell University Nutrient Management Spear Program. Agronomy Fact Sheet 36: Illinois Soil Nitrogen Test (ISNT). (ISNT estimates amino-sugar N via NaOH hydrolysis to NH3, acidimetric titration; ~235 ppm Illinois critical value.)
- 27.Iowa State University Extension, Integrated Crop Management. The Illinois Soil Nitrogen Test: Should it be used in Iowa? (No relationship between ISNT and relative unfertilized yield or EONR across 43 Iowa on-farm trials; Illinois critical value did not transfer; not recommended for N-rate decisions.)
- 28.Cornell Soil Health Laboratory. Individual soil analyses: Autoclaved Citrate-Extractable (ACE) soil protein. (Autoclaved sodium-citrate extraction + BCA colorimetric assay; index of organically bound N reservoir; ~$30/sample.)
- 29.Curtin, D., Wright, C.E., Beare, M.H., McCallum, F.M. (2006). Evaluation of hot KCl extraction as an index of mineralizable nitrogen. Canadian Journal of Soil Science 86(special). DOI:10.4141/S06-047. (2 M KCl at 100 C for ~4 h; hot-KCl NH4-N minus room-temp KCl NH4-N correlated with PMN.)
- 30.Haney, R.L. & Franzluebbers, A.J. Estimating Soil Carbon, Nitrogen, and Phosphorus Mineralization from Short-Term Carbon Dioxide Respiration (Haney/Solvita 24-h CO2 burst method; rewet air-dried soil at ~70 F; CO2 flush related to 28-d aerobic N mineralization R2=0.83 and water-extractable N R2=0.76).
- 31.Cabrera, M.L. (1993). Modeling the Flush of Nitrogen Mineralization Caused by Drying and Rewetting Soils. Soil Science Society of America Journal 57(1):63-66. DOI:10.2136/sssaj1993.03615995005700010012x. (Two-pool model: first-order flush superimposed on zero-order background; drying-rewetting raises background mineralization rate.)
- 32.Jarvis, P.G. et al. (2007). Drying and wetting of Mediterranean soils stimulates decomposition and carbon dioxide emission: the Birch effect. Tree Physiology 27(7):929-940. PubMed 17403645.
- 33.Wade, J. et al. (2021). Pre-incubation Soil Handling Can Influence Comparability of Potentially Mineralizable Nitrogen Results. Communications in Soil Science and Plant Analysis 52(10):1121-1131. DOI:10.1080/00103624.2021.1872607. (Refrigeration, freezing, air-drying, grinding effects on 7-day anaerobic PMN; soil-by-pretreatment interaction driven by field-moist vs air-dried; standardized handling needed.)
- 34.Bonde, T.A. & Rosswall, T. (1987). Seasonal Variation of Potentially Mineralizable Nitrogen in Four Cropping Systems. Soil Science Society of America Journal 51(6):1508-1514. DOI:10.2136/sssaj1987.03615995005100060019x. (Mineralizable N declined spring-to-harvest, rose into autumn; 13-wk aerobic incubation at 37 C; 188-483 kg N/ha.)
- 35.Sullivan, D.M., Moore, A.D., Verhoeven, E., Brewer, L.J. (2020). Baseline Soil Nitrogen Mineralization: Measurement and Interpretation. Oregon State University Extension Service, EM 9281. (Mineralization ~half of crop N uptake; ~1-3% of SOM-N mineralized annually; ~100 lb N/ac from a 3% SOM soil; supply-demand asynchrony; tests must be calibrated to predict field rates.)
Cite this articleShow formats
Cite this article
Citation-ready record
APA
Soil Health Exchange Team (2026). What Potentially Mineralizable Nitrogen (PMN) Tells You About Your Soil's Nitrogen Engine — and What It Won't. Soil Health Exchange. https://soilhealthexchange.com/blog/interpreting-soil-health-indicators-pmn
More citation formats
MLA
Soil Health Exchange Team. "What Potentially Mineralizable Nitrogen (PMN) Tells You About Your Soil's Nitrogen Engine — and What It Won't." Soil Health Exchange, 2026-06-15, https://soilhealthexchange.com/blog/interpreting-soil-health-indicators-pmn.
Chicago
Soil Health Exchange Team. "What Potentially Mineralizable Nitrogen (PMN) Tells You About Your Soil's Nitrogen Engine — and What It Won't." Soil Health Exchange. Published 2026-06-15. https://soilhealthexchange.com/blog/interpreting-soil-health-indicators-pmn.
Citation metadata is provided for discovery tools and reference managers. Inclusion in external scholarly indexes is not guaranteed.
Continue reading
All articles →From this series
Understanding & Interpreting Soil Health Indicators

Part 1
PLFA Analysis: What Soil Biology Testing Can and Cannot Tell You
PLFA is the most reproducible method for measuring living microbial biomass in soil — but no validated thresholds exist for interpreting the numbers. Here is what the science actually supports.

Part 2
What an ACE Protein Test Actually Tells You (and What It Doesn't)
The ACE protein test estimates the size of the soil's organically bound nitrogen reservoir.
Part 3
What POX-C (Active Carbon) Actually Tells You About Your Soil
Permanganate-oxidizable carbon (POX-C) is the most popular "active carbon" soil health test for good reason: it's cheap, repeatable, and moves with management faster than total organic carbon. Here's what the number means, how to read it for your soil, what actually shifts it, and the limitations that should keep you from over-interpreting it.
Part 4 · You’re reading this
What Potentially Mineralizable Nitrogen (PMN) Tells You About Your Soil's Nitrogen Engine — and What It Won't
Part 5
What the 4-Day CO2 Burst Actually Tells You (and What It Doesn't)
Part 5 of our soil health indicator series: how the CO2 burst test (Solvita, Haney, Cornell CASH) measures the living, active fraction of your soil's carbon, how to read the number against texture-specific research benchmarks and producer-facing CO2-C bands, which management practices actually move it, and why the same soil can give very different answers depending on which lab and method you use.
Discussion
No comments yet. Be the first to share your thoughts!