Part 3 · Understanding & Interpreting Soil Health Indicators
Research Brief
What POX-C (Active Carbon) Actually Tells You About Your Soil
Permanganate-oxidizable carbon (POX-C) is the most popular "active carbon" soil health test for good reason: it's cheap, repeatable, and moves with management faster than total organic carbon. Here's what the number means, how to read it for your soil, what actually shifts it, and the limitations that should keep you from over-interpreting it.
Bottom line up front
POX-C (permanganate-oxidizable carbon, sold as "active carbon") captures a processed, intermediate-turnover slice of soil organic carbon — roughly 1-4% of your total SOC [2][11]. It moves with management faster than total carbon and is significantly related to total SOC [2], which makes it a useful early-warning trend gauge for whether you're building or burning down organic matter. A 2025 global database of 10,068 paired comparisons from 284 peer-reviewed studies was assembled specifically to study how POX-C responds to land-use and management change [13]. Higher POX-C is often correlated with greater microbial activity and nutrient cycling [12], but treat it as a directional indicator on your own ground over time — not a universal pass/fail line and not a fertility test [10].
What POX-C actually measures
The test is deceptively simple: you mix soil with a dilute (0.02 M) potassium permanganate solution, shake briefly at room temperature, and watch how much of the permanganate's purple color disappears. The color loss — read on a spectrophotometer at 550 nm — is proportional to the amount of carbon the permanganate oxidized [1][1]. More oxidizable carbon, more fading, higher number. Results are conventionally reported as milligrams of carbon per kilogram of soil (ppm) [1][1], though current SOPs increasingly report mmol MnO4 reduced per kg instead, for reasons covered below [7][7].
Conceptually, POX-C is interpreted as a biologically active, "processed" pool of soil organic matter — material that has already been worked over by microbes and sits on an intermediate decomposition timescale, somewhere between fast-cycling labile compounds and the stable, passive humified fraction [2][2][12][12]. Because it is thought to index energy available to the soil's microbial community, higher POX-C is often correlated with greater microbial activity and nutrient cycling [12][12]. That association is empirical and soil-specific rather than mechanically guaranteed, however — as the next callout explains, the assay also oxidizes lignin, which is not readily bioavailable microbial energy, so a high number does not by itself prove greater biological activity [14][14].
It is not pure "labile" carbon
The popular shorthand of POX-C as the easy, sugary, fast-food fraction of soil carbon is an oversimplification. Recent mechanistic work shows the 0.02 M permanganate assay is sensitive to lignin — a slower-decomposing, complex molecule [14] — and permanganate is more broadly known to react with substituted phenolic compounds rather than being selective for biologically active carbon [15]. So the pool it reports includes more than just the readily metabolizable stuff. That doesn't make the number useless; it just means "active carbon" is a marketing label, not a precise biochemical definition, and it complicates any clean "energy for microbes" interpretation [14][15].
How the lab runs it
The canonical method is Weil et al. (2003) [1][1]; the modern, widely adopted refinement standardized 2.5 g of soil and a 0.02 M reaction (Culman et al. 2012) [2][2]. Separately, current protocols increasingly no longer adjust the permanganate stock to pH 7.2, because the buffering collapses within about 24 hours and does not change the POX-C result — though adoption is not universal. The OSU protocol credits this finding to Gruver (2015) [3][3]; the UIUC SOP attributes it to "Culman et al. (2020)," which resolves to the Culman, Hurisso & Wade (2021) method chapter [4][4] — there is no standalone 2020 POX-C paper. The basic recipe used by labs like Ohio State and the University of Illinois [6][6][7][7]:
- Weigh 2.50 g (± 0.05 g) of air-dried soil, ground to pass a 2 mm sieve [2][2] (Weil's original 2003 method used 5.0 g [1][1]).
- React it with 0.02 M permanganate (2.0 mL of 0.2 M KMnO4 stock + 18.0 mL water). The stock is 0.2 M KMnO4 dissolved in 1.0 M CaCl2, which dilutes to ~0.1 M CaCl2 in the reaction tube and helps the soil flocculate and settle [6][6][9][9].
- Shake exactly 2 minutes, then let it settle exactly 10 minutes — timing matters [1][1][6][6][9][9].
- Dilute the supernatant 1:100 (0.5 mL into 49.5 mL water) and read absorbance at 550 nm against permanganate standards [1][1].
- Convert the permanganate consumed to oxidizable C using the historical 9000 mg C per mol MnO4 factor, scaled to the soil mass [1][1][8][8].
Why two labs can hand you different numbers
POX-C is cheap and fast, but it is procedurally fussy. Sample mass and grind/sieve size markedly change the result, which undermines cross-lab comparability — a documented obstacle to using POX-C as a national standard [16]. Protocols also diverge in detail: newer SOPs (e.g. UIUC [7]) drop the pH 7.2 adjustment, while some standing procedures such as the OSU/KBS-LTER mirror [8] still include it. And the 9000 mg C/mol conversion is a convention, not a measured truth. The standing lab assumption — stated explicitly in the OSU/KBS-LTER procedure — is that 9000 is "the mg of C oxidized by 1 mole of MnO4 changing from Mn7+ to Mn2+" [8]. Critique work argues that assumption is wrong: under the assay's near-neutral conditions the true reduction product and the number of electrons transferred are not fixed or known (permanganate may be reduced only toward Mn4+ rather than Mn2+), so the constant rests on an unverified redox stoichiometry and POX-C should not be read as a quantitative carbon measurement [14][15]. That is why some labs now report mmol MnO4 reduced per kg rather than mg C [7]. Practical upshot: pick one lab and one protocol and stay with it.
How to read your number
There is no single universal POX-C threshold, because the test is sensitive to texture, pH, and climate — values tend to run higher in clays and acidic soils [12][12]. The ranges below are anchored to specific regions, soils, and lab databases; use the row that matches your context, and read your own value as "low / typical / high" relative to comparable soils [10][10][11][11]. As a large-sample anchor, a Missouri statewide dataset of 13,143 agricultural samples averaged 516 ppm (median 507), spanning 15-1,244 ppm overall, with the middle 80% of fields falling between 320 and 724 ppm (10th-90th percentile) [10][10].
POX-C interpretive ranges by context
| Context | Low (ppm) | Typical (ppm) | High (ppm) | Source |
|---|---|---|---|---|
| General ag soils, upper Midwest / N. Great Plains | <300 | — | 1000 | [11] |
| Native prairie / undisturbed soils | — | — | ~1500 | [11] |
| Missouri statewide (13,143 samples) | 200 | 516 | 800 | [10] |
| Loamy soils, Missouri | 327 | 500 | 724 | [10] |
| Clayey soils, Missouri | 356 | >550 | 802 | [10] |
| Sandy soils, Missouri | 97 | <300 | 502 | [10] |
Reported POX-C ranges by soil context (mg C/kg, ppm). "Typical" is the source-stated mean or median; low and high are the source-stated low- and high-end values. Cells marked "—" are not reported by the cited source. Sources: AGVISE [11] (single endpoints, commercial lab, not peer-reviewed); University of Missouri Extension G9073, n=13,143 [10].
To put a single field's reading on the statewide curve, use the Missouri percentile distribution directly: it converts an abstract ppm number into "where do I sit among 13,143 real cropland samples" [10][10]. A value near 320 ppm is bottom-decile for Missouri cropland; near 724 ppm is top-decile.
Missouri cropland POX-C distribution (n=13,143)
Percentile reference points for POX-C across 13,143 Missouri agricultural samples (mg C/kg). Read your own value against these statewide benchmarks rather than a universal threshold. Source: University of Missouri Extension G9073 [10]. unit = ppm POX-C.
Notice that AGVISE reports native prairie active carbon as high as ~1500 ppm, well above the <300-1000 ppm range it gives for cultivated ground [11][11]. Native prairie often reads higher than nearby cultivated land, a pattern commonly attributed to organic-matter loss under cultivation — but this is a cross-sectional snapshot from a single non-peer-reviewed commercial lab, not evidence that reducing tillage will move a given field to prairie levels. Within the Missouri dataset, clayey soils read higher than loamy and sandy ones [10][10] — direct evidence that you should not compare a clay field's number against a sandy field's and conclude one is "healthier."
How to sample for a valid reading
POX-C is operationally defined, so a comparable number depends on disciplined sampling. (1) Sample to the same depth every time. The standard soil-health depth is 0-6 in, but under no-till and reduced tillage active carbon is strongly stratified toward the surface — in 10-year no-till plots, POX-C, CO2-burst, and organic matter in the top 2 in run much higher than in the 2-4 in and 4-6 in layers [18]. A shallow or surface-only core therefore reads high, and an inconsistent depth is the most common way to fool yourself when tracking trends [18]. (2) Sample at the same point in the season and rotation, and re-sample GPS-marked locations [11][18]. (3) And, as noted above, stay with one lab and one protocol, because soil mass and grind/sieve size shift POX-C values between methods [16].
What management actually moves it
POX-C's selling point is sensitivity. In a synthesis of 12 studies and 53 sites, POX-C was the more sensitive indicator — relative to particulate organic carbon, microbial biomass C, and total SOC — in 42% of the significant experimental comparisons examined [2][2]. That is more often than any single one of those alternatives, but still a minority of cases: no indicator dominated, and POX-C did not "win" most head-to-heads. To study the broader pattern at scale, a 2025 global database compiled 10,068 paired comparisons from 284 peer-reviewed studies documenting POX-C responses to land-use and management change; it is a data resource assembled to enable further investigation, not itself a meta-analysis that settles whether POX-C out-responds total SOC [13][13]. Separately, Hurisso et al. (2016) found that POX-C aligned more with organic-matter stabilization metrics while a different test, mineralizable carbon, tracked short-term nutrient mineralization, and the two can even respond in opposite directions [5][5]. The moves below generally push POX-C up — directionally, on average — though the effect sizes are largely observational and vary widely by region and method [10][10][12][12].
Global POX-C evidence base (land-use & management database)
| Database attribute | Value |
|---|---|
| Paired comparisons | 10,068 |
| Peer-reviewed studies | 284 |
| Countries | 45 |
| Land-use / cover categories | 63 |
| Arable-system comparisons | 7,809 |
| Nature of resource | Descriptive database compiled to study POX-C management responses |
Scope of the global KMnO4-oxidisable carbon database, which compiles paired comparisons of land-use and management change from the peer-reviewed literature as a data resource for studying POX-C responses (a descriptive database, not a meta-analysis). Source: Scientific Data (2025) [13].
The single most reliable lever is continuous living cover. A global meta-analysis of cover-cropping systems found that, relative to bare fallow, cover crops raised POX-C by about 13% — modest in absolute terms because POX-C is only one of several carbon fractions cover crops move, and not the most reactive one. In the same analysis microbial biomass C rose 33%, dissolved organic C 18%, particulate organic C 15%, and even total SOC 12% [19][19]. These are global meta-analytic means with wide variation by soil texture, climate, and cover-crop duration and type; individual site responses range widely around them. The chart below shows that POX-C is one of several fractions that respond to cover crops, and far from the most responsive — microbial biomass C moves much harder, a useful reminder that POX-C is a directional gauge, not the most reactive thing you could measure.
Soil carbon fractions under cover crops vs. bare fallow
Mean percentage increase in selected soil organic carbon fractions under cover-cropping systems relative to bare fallow, from a global meta-analysis. These are global averages; site responses vary widely with soil, climate, and cover-crop duration. The source [19] also reports light-fraction organic C +14% and mineral-associated organic C +7%, omitted here for clarity, so this chart is a subset of the reported fractions. POX-C (active carbon) responds, but microbial biomass C responds far more strongly. Source: Hu et al. (2023), Agriculture, Ecosystems & Environment [19]. unit = % increase vs. bare fallow.
Field trials confirm the meta-analytic signal and show that intensity matters: in an 8-year intensive organic-vegetable trial in Salinas, California, increasing winter cover-crop frequency from quadrennial to annual raised POX-C by about 26%, and at year 6 an annual legume-rye cover crop had POX-C 59% above a minimal-input control [20][20]. Diversifying the rotation and adding perenniality pushes in the same direction: systems with greater perenniality and crop diversity carried significantly higher POX-C than annual monocultures, and rotated annuals with a cover crop out-built continuous corn for both POX-C and soil organic matter [21][21].
Organic amendments also raise active carbon, but the source matters, because compost and manure load different pools. Composted (more stabilized) inputs tend to build the POX-C pool itself, whereas fresh manure preferentially feeds the short-term respiration/mineralizable-C pool — Hurisso et al. (2016) found compost addition associated more with POX-C and manure addition associated more with mineralizable carbon [5][5]. The same California trial bears this out: compost drove the largest gain in total SOC (the paper's abstract reports a mean increase of about 9.4 Mg/ha averaged over years 2-8; the Results section reports the central compost-vs-control mean difference as 7.1 Mg/ha, 95% CI 4.9-9.4) while also lifting POX-C, though increasing cover-crop frequency had the larger POX-C effect of the two practices [20][20].
Working against all of those building practices, warmer temperatures and persistently moist soil speed decomposition and can pull POX-C down [12][12]. The reason it tracks management well is that it moves with — but ahead of — total SOC: across Culman et al.'s 12-study synthesis, POX-C was significantly related to total SOC (strongest when analyzed study by study rather than pooled) while responding faster [2][2], and AGVISE reports a strong relationship with overall soil organic matter (r = 0.80) [11][11]. The headline cross-study relationship is weaker and more variable than the near-perfect coefficients sometimes quoted.
Observed POX-C differences under reduced tillage
Observed differences in POX-C between no-till and conventional systems — observational comparisons, not controlled effect sizes; geography, soil type, and farmer selection are confounded. The Missouri bar is a ~5,300-sample statewide difference [10]; the North Dakota bar is a single-station (n=1) 17-year no-till case study at Mandan (470→600 ppm) reported by AGVISE [11]. The two are not comparable effect sizes — one is a population statistic, one is a single site. unit = % difference vs. comparison group.
Taken together, then, the practices the evidence ties to a rising active-carbon line are continuous living cover, reduced tillage, diversified rotations, perennials, and composted organic amendments — with the important caveat that the magnitudes above are largely observational and field-specific. For how to put that to work, see the trend-monitoring guidance below and the closing section.
Use it as a trend line
Because POX-C reacts years before total SOC shows a measurable change, its highest value is as a same-field, same-lab, same-season trend monitor. Sample a transition field before you start cover-cropping or cutting tillage, then re-sample on the same schedule. A rising line is real-time confirmation your carbon-building program is moving organic matter in the right direction — long before total-carbon tests would notice. Just don't over-read it: a rising POX-C line confirms trajectory, not a yield or profitability payoff, which Missouri data show POX-C explains only a small share of [10].
POX-C vs. CO2 respiration: two different carbon questions
POX-C is often run alongside a short-term CO2-respiration (mineralizable carbon) test, and the pairing trips people up because the two answer different questions [5][5]. POX-C indexes a processed, partly stabilized carbon pool; the CO2 burst measures how fast microbes respire when a dried soil is rewetted — a proxy for short-term nutrient (especially nitrogen) supply. This is the same split that separates compost from manure as amendments: compost preferentially builds the POX-C pool, manure the respiration pool [5][5]. Unlike POX-C, the common CO2 tests ship with published interpretive bands, so it is worth knowing where the cutoffs sit when you read a combined panel. The widely used Solvita CO2 Index maps a color scale to ppm CO2-C and a predicted annual N release [17][17]:
Solvita CO2 respiration interpretive bands
| Color band | CO2-C (ppm) | Microbial activity | Predicted N release (lb N/ac) |
|---|---|---|---|
| Blue-Gray | 0-5 | Very low soil activity | <15 |
| Gray-Green | 6-12 | Moderately low soil activity | 15-25 |
| Green | 13-30 | Medium soil activity | 25-45 |
| Green-Yellow | 31-70 | Ideal soil activity | 45-75 |
| Yellow | 71-160 | Unusually high soil activity | 75-105 |
Solvita CO2 Index color scale: ppm CO2-C, activity category, and predicted annual N release (lb N/ac). Per the source, the laboratory CO2-burst method runs roughly 2-4x higher than the field method. Source: Ohio State University CFAES (Sundermeier & Shedekar), Solvita CO2 Respiration white paper [17].
Source [17][17] also cautions that the lab-run CO2-burst method typically reads 2-4 times higher than the field method, so the two are not interchangeable [17][17]. The takeaway for a POX-C user: don't expect the POX-C and CO2 numbers to track each other. Use POX-C to read organic-matter trajectory and the CO2 burst to read short-term N supply [5][5][17][17].
What POX-C cannot tell you
- It is not a fertility test. Its relationship to crop yield is modest — Missouri data found a corn-yield inflection near 415 ppm (in Missouri specifically, not a transferable cutoff for other regions or crops), but POX-C explained only a small share of yield variation, and high POX-C does not guarantee adequate nutrient availability [10][10].
- It is not pure labile carbon. The assay is sensitive to lignin and other phenolic compounds, so the biological interpretation of the pool is muddier than the "active carbon" name implies [14][14][15][15].
- It is not directly comparable across labs. Sample mass and grind/sieve size strongly change the value, which is why it struggles as a standardized national metric [16][16].
- Its absolute number is soil-specific. Texture, pH, and climate all shift it (higher in clays and acidic soils), so compare within similar soils and over time, not against universal thresholds [12][12].
- The conversion has a known weak spot. The 9000 mg C/mol factor assumes a Mn7+→Mn2+ transfer [8][8], but critique work shows the true reduction product and electron transfer are not fixed or known under assay conditions, so the mg-C value is a flawed convention; some labs report mmol MnO4 reduced per kg instead [7][7][14][14][15][15].
- Reported management responses are mostly observational. Many of the largest figures come from extension and lab datasets and cross-sectional comparisons rather than controlled meta-analyses, so magnitudes vary by region and method, and causal effect sizes should not be inferred from them [13][13].
Bottom line
POX-C earns its place in a soil health panel as a cheap, fast, sensitive early indicator of where your organic matter is heading [2][2][13][13]. Read it as a directional signal on your own fields, sampled consistently through one lab, at one depth, against soils of similar texture [12][12][16][16][18][18]. Build it with continuous living cover, diverse rotations, and composted amendments — the levers the evidence most consistently ties to a rising active-carbon line, recognizing the magnitudes vary by field [19][19][20][20][21][21]. Pair it with a mineralizable-carbon test if you also want a read on short-term nutrient supply, since the two answer genuinely different questions [5][5][17][17]. What POX-C will not do is replace a fertility test or settle an argument between two fields with different textures [10][10][12][12] — keep those jobs with the tools built for them.
Test Your Knowledge
Each attempt draws 8 questions from a 12-question pool and shuffles both the questions and answer choices. Score 85% or higher to earn a Certificate of Completion.
1.In the lab, what physical change does the POX-C test actually measure?
2.Conceptually, which pool of soil organic matter is POX-C interpreted as indexing?
3.Why does the article caution that a high POX-C value does not by itself prove greater biological activity?
4.Why should the Missouri dataset average of about 516 ppm POX-C not be used as a universal target?
5.In the global cover-cropping meta-analysis cited, which carbon fraction responded most strongly to cover crops relative to bare fallow?
6.How should the article's compost-versus-fresh-manure comparison be interpreted?
7.What is the defensible value of pairing POX-C with a CO2-burst test?
8.Which limitation does the article give for why POX-C struggles as a standardized national metric?
Written by
Soil Health Exchange Team
Scholarly record
References & Citation
Source material for every claim in this article, plus a citation-ready record for reference managers and scholarly indexes.
Cite this
Reference this work
Soil Health Exchange Team (2026). What POX-C (Active Carbon) Actually Tells You About Your Soil. Soil Health Exchange. SHE-ART-2026-0016. https://soilhealthexchange.com/cite/SHE-ART-2026-0016
Soil Health Exchange assigns a stable identifier to every published answer and article. Citations keep working even if the URL changes later.
Sources (21)Show sources
- 1.Weil, R.R., K.R. Islam, M.A. Stine, J.B. Gruver, S.E. Samson-Liebig (2003). Estimating active carbon for soil quality assessment: A simplified method for laboratory and field use. American Journal of Alternative Agriculture 18(1):3-17.
- 2.Culman, S.W., S.S. Snapp, M.A. Freeman, M.E. Schipanski, J. Beniston, et al. (2012). Permanganate Oxidizable Carbon Reflects a Processed Soil Fraction that is Sensitive to Management. Soil Science Society of America Journal 76(2):494-504.
- 3.Gruver, J. (2015). Evaluating the Sensitivity and Linearity of a Permanganate-Oxidizable Carbon Method. Communications in Soil Science and Plant Analysis 46(4):490-510.
- 4.Culman, S.W., T.T. Hurisso, J. Wade (2021). Permanganate Oxidizable Carbon. Ch. 9 in D.L. Karlen, D.E. Stott & M.M. Mikha (eds.), Laboratory Methods for Soil Health Analysis (Soil Health Series, Vol. 2), pp. 152-175. SSSA/Wiley.
- 5.Hurisso, T.T., S.W. Culman, W.R. Horwath, J. Wade, D. Cass, et al. (2016). Comparison of Permanganate-Oxidizable Carbon and Mineralizable Carbon for Assessment of Organic Matter Stabilization and Mineralization. Soil Science Society of America Journal 80(5):1352-1364.
- 6.Ohio State University Soil Fertility Lab (2019). Procedure for the Determination of Permanganate Oxidizable Carbon (POXC Protocol, rev. 10/2019).
- 7.Margenot, A.J. / UIUC Soils Lab (2021). SOP: Permanganate Oxidizable Carbon (POXC), University of Illinois Urbana-Champaign (last revised 27 July 2021).
- 8.Michigan State University KBS LTER. Protocol #133: Procedure for the Determination of Permanganate Oxidizable Carbon (open mirror of the OSU POXC procedure; contains the 9000 mg C/mol = Mn7+ to Mn2+ calculation note).
- 9.Cornell University Field Crops Extension. Agronomy Fact Sheet #133: Active Carbon. Cornell Soil Health (Comprehensive Assessment of Soil Health / CASH). Uses 2.5 g soil, 2-minute shake and 10-minute settle.
- 10.Parvej, Md. R., D. Brandt, R. Myers, K. Nelson, T. Reinbott, G. Singh / University of Missouri Extension (Nov 2025). Permanganate Oxidizable Carbon (POXC): A Sensitive Indicator of Reactive Soil Carbon. MU Extension G9073 (n=13,143; mean 516, median 507, range 15-1,244, 10th-90th pct 320-724 ppm).
- 11.AGVISE Laboratories. Active carbon (POXC): What does it measure?
- 12.Vellenga, M., P.M. Ewing, J. Tracy, M. English, D. Neher, H. Darby, J. Faulkner (2025). POXC. UVM-SHREC-FS-07-02, University of Vermont Soil Health Research and Extension Center.
- 13.A global database on land use and management change effects on soil KMnO4-oxidisable organic carbon (POXC) (2025). Scientific Data (data descriptor; 10,068 comparisons, 284 studies, 45 countries, 63 land uses; arable n=7,809).
- 14.Woodings, F.S., A.J. Margenot (2023). Revisiting the permanganate oxidizable carbon (POXC) assay assumptions: POXC is lignin sensitive. Agricultural & Environmental Letters 8(1):e20108.
- 15.Margenot, A.J., J. Wade, F.S. Woodings (2024). The misuse of permanganate as a quantitative measure of soil organic carbon. Agricultural & Environmental Letters 9(1):e20124.
- 16.Pulleman, M., S. Wills, R. Creamer, R. Dick, R. Ferguson, et al. (2020). Soil mass and grind size used for sample homogenization strongly affect permanganate-oxidizable carbon (POXC) values, with implications for its use as a national soil health indicator. Geoderma 383:114742.
- 17.Sundermeier, A., V. Shedekar. Solvita CO2 Respiration Soil Health Test. Ohio State University CFAES Extension white paper (Solvita CO2 Index color scale: ppm CO2-C bands, activity categories, and predicted N release; notes lab burst method runs ~2-4x the field method).
- 18.Oklahoma State University Extension. The Importance of Sampling Depth for Soil Health Assessment, Fact Sheet PSS-2285. (Standard 0-6 in depth; in 10-yr no-till plots, active carbon/POXC, CO2-burst and organic matter in the 0-2 in layer were much higher than in 2-4 in and 4-6 in layers; shallow/surface-only sampling inflates values; use consistent GPS-marked depth/location for tracking.)
- 19.Hu, Q., B.W. Thomas, D. Powlson, Y. Hu, Y. Zhang, X. Jun, X. Shi, Y. Zhang (2023). Soil organic carbon fractions in response to soil, environmental and agronomic factors under cover cropping systems: A global meta-analysis. Agriculture, Ecosystems & Environment 355:108591. (Cover crops vs bare soil: POXC +13%, MBC +33%, DOC +18%, POC +15%, LFOC +14%, SMC +10%, MAOC +7%, total SOC +12%.)
- 20.White, K.E., E.B. Brennan, M.A. Cavigelli, R.F. Smith (2020). Winter cover crops increase readily decomposable soil carbon, but compost drives total soil carbon during eight years of intensive, organic vegetable production in California. PLOS ONE 15(2):e0228677. (Annual vs quadrennial cover cropping: POX-C +26% after 8 yr; year 6 annual legume-rye cover crop +59% vs minimal input, +28% vs compost-only; compost increased total SOC most — abstract reports mean +9.4 Mg/ha over yrs 2-8, Results report central mean difference 7.1 Mg/ha, 95% CI 4.9-9.4 — and also raised POX-C.)
- 21.Sprunger, C.D., T. Martin, M. Mann (2020). Systems with greater perenniality and crop diversity enhance soil biological health. Agricultural & Environmental Letters 5(1):e20030. (Perennial polycultures had significantly greater POXC than annual/monoculture systems; mineralizable C +88% vs annual and +23% vs monoculture perennial; rotated annuals + cover crop increased POXC and SOM vs continuous corn.)
Cite this articleShow formats
Cite this article
Citation-ready record
APA
Soil Health Exchange Team (2026). What POX-C (Active Carbon) Actually Tells You About Your Soil. Soil Health Exchange. https://soilhealthexchange.com/blog/poxc-active-carbon-soil-health-indicator
More citation formats
MLA
Soil Health Exchange Team. "What POX-C (Active Carbon) Actually Tells You About Your Soil." Soil Health Exchange, 2026-06-15, https://soilhealthexchange.com/blog/poxc-active-carbon-soil-health-indicator.
Chicago
Soil Health Exchange Team. "What POX-C (Active Carbon) Actually Tells You About Your Soil." Soil Health Exchange. Published 2026-06-15. https://soilhealthexchange.com/blog/poxc-active-carbon-soil-health-indicator.
Citation metadata is provided for discovery tools and reference managers. Inclusion in external scholarly indexes is not guaranteed.
Continue reading
All articles →From this series
Understanding & Interpreting Soil Health Indicators

Part 1
PLFA Analysis: What Soil Biology Testing Can and Cannot Tell You
PLFA is the most reproducible method for measuring living microbial biomass in soil — but no validated thresholds exist for interpreting the numbers. Here is what the science actually supports.

Part 2
What an ACE Protein Test Actually Tells You (and What It Doesn't)
The ACE protein test estimates the size of the soil's organically bound nitrogen reservoir.
Part 3 · You’re reading this
What POX-C (Active Carbon) Actually Tells You About Your Soil
Part 4
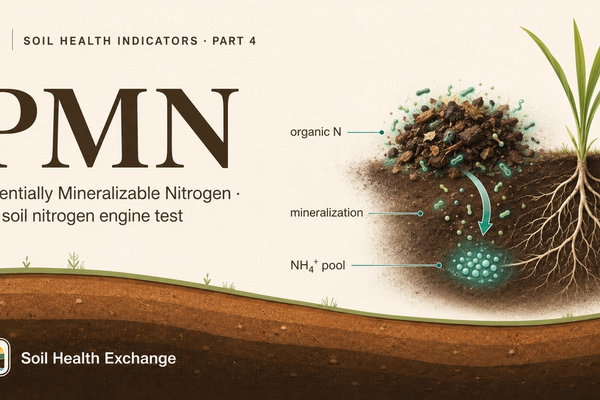
What Potentially Mineralizable Nitrogen (PMN) Tells You About Your Soil's Nitrogen Engine — and What It Won't
Part 4 of Understanding & Interpreting Soil Health Indicators: what Potentially Mineralizable Nitrogen (PMN) measures, the first-order mineralization kinetics behind it, how the lab runs the 7-day anaerobic incubation, how PMN compares to PSNT, ISNT, ACE protein, hot-KCl and the CO2 burst, how to sample and handle a fresh-soil-only test, what management moves it, and why it is a useful capacity index but a weak stand-alone fertilizer predictor.
Part 5
What the 4-Day CO2 Burst Actually Tells You (and What It Doesn't)
Part 5 of our soil health indicator series: how the CO2 burst test (Solvita, Haney, Cornell CASH) measures the living, active fraction of your soil's carbon, how to read the number against texture-specific research benchmarks and producer-facing CO2-C bands, which management practices actually move it, and why the same soil can give very different answers depending on which lab and method you use.
Discussion
No comments yet. Be the first to share your thoughts!