A sandy, semi-arid soil should not be graded against a humid clay loam. Here is how Soil Health Gap, ecological reference units, and a Two-Tier framework can replace generic targets with fairer, field-specific benchmarks.
Editor's Note
Originally published February 1, 2026; updated September 4, 2026, following publication of the peer-reviewed Two-Tier framework. This article explains work developed by the author and collaborators across four peer-reviewed papers published between 2020 and 2026.
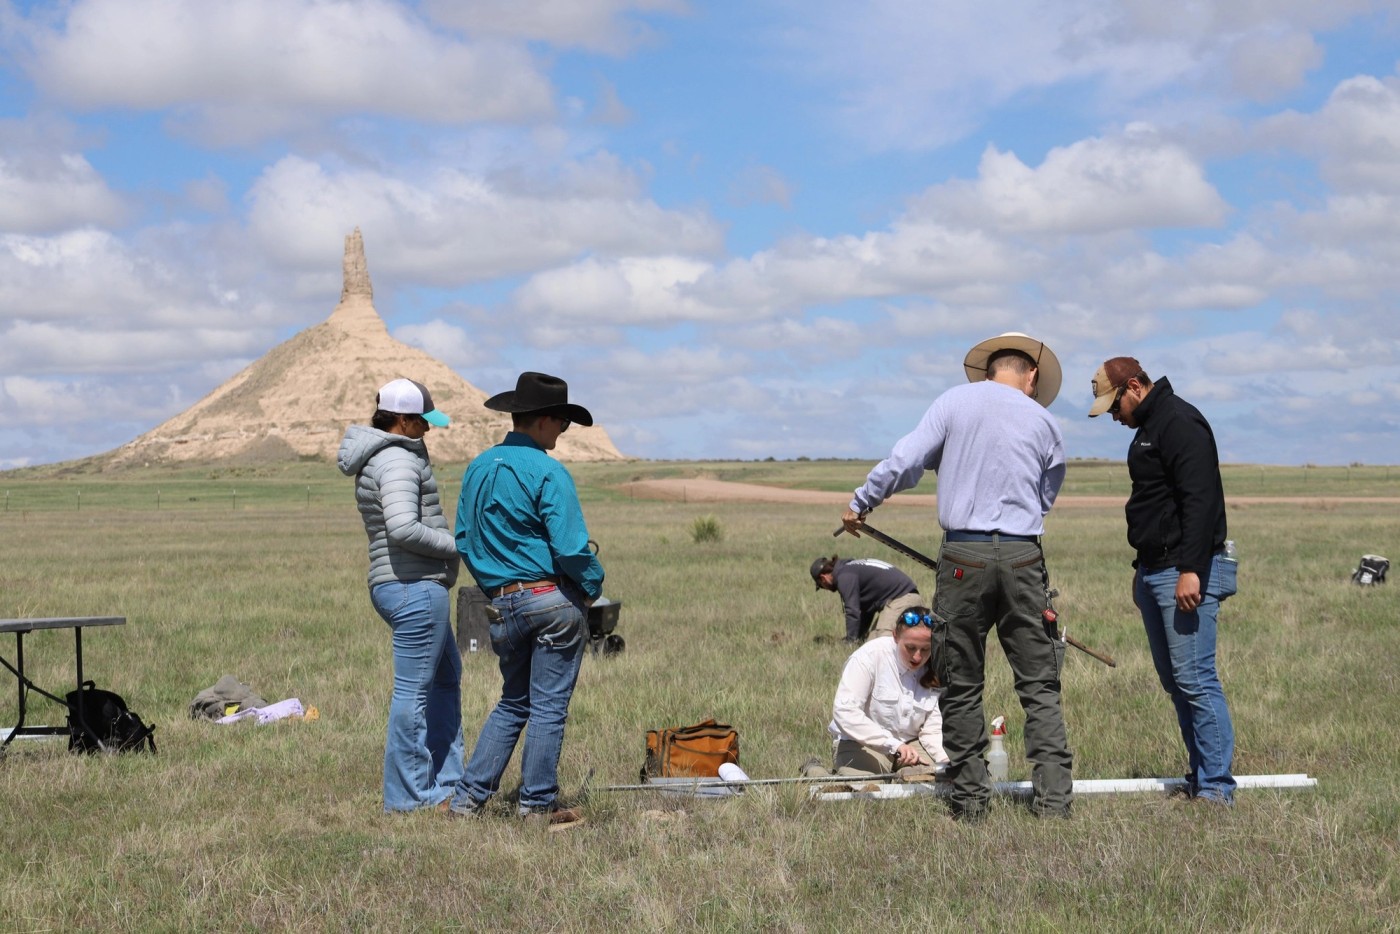
Reference benchmarks begin in the field: matching soil, ecological state, and climate before comparing a cropland result.
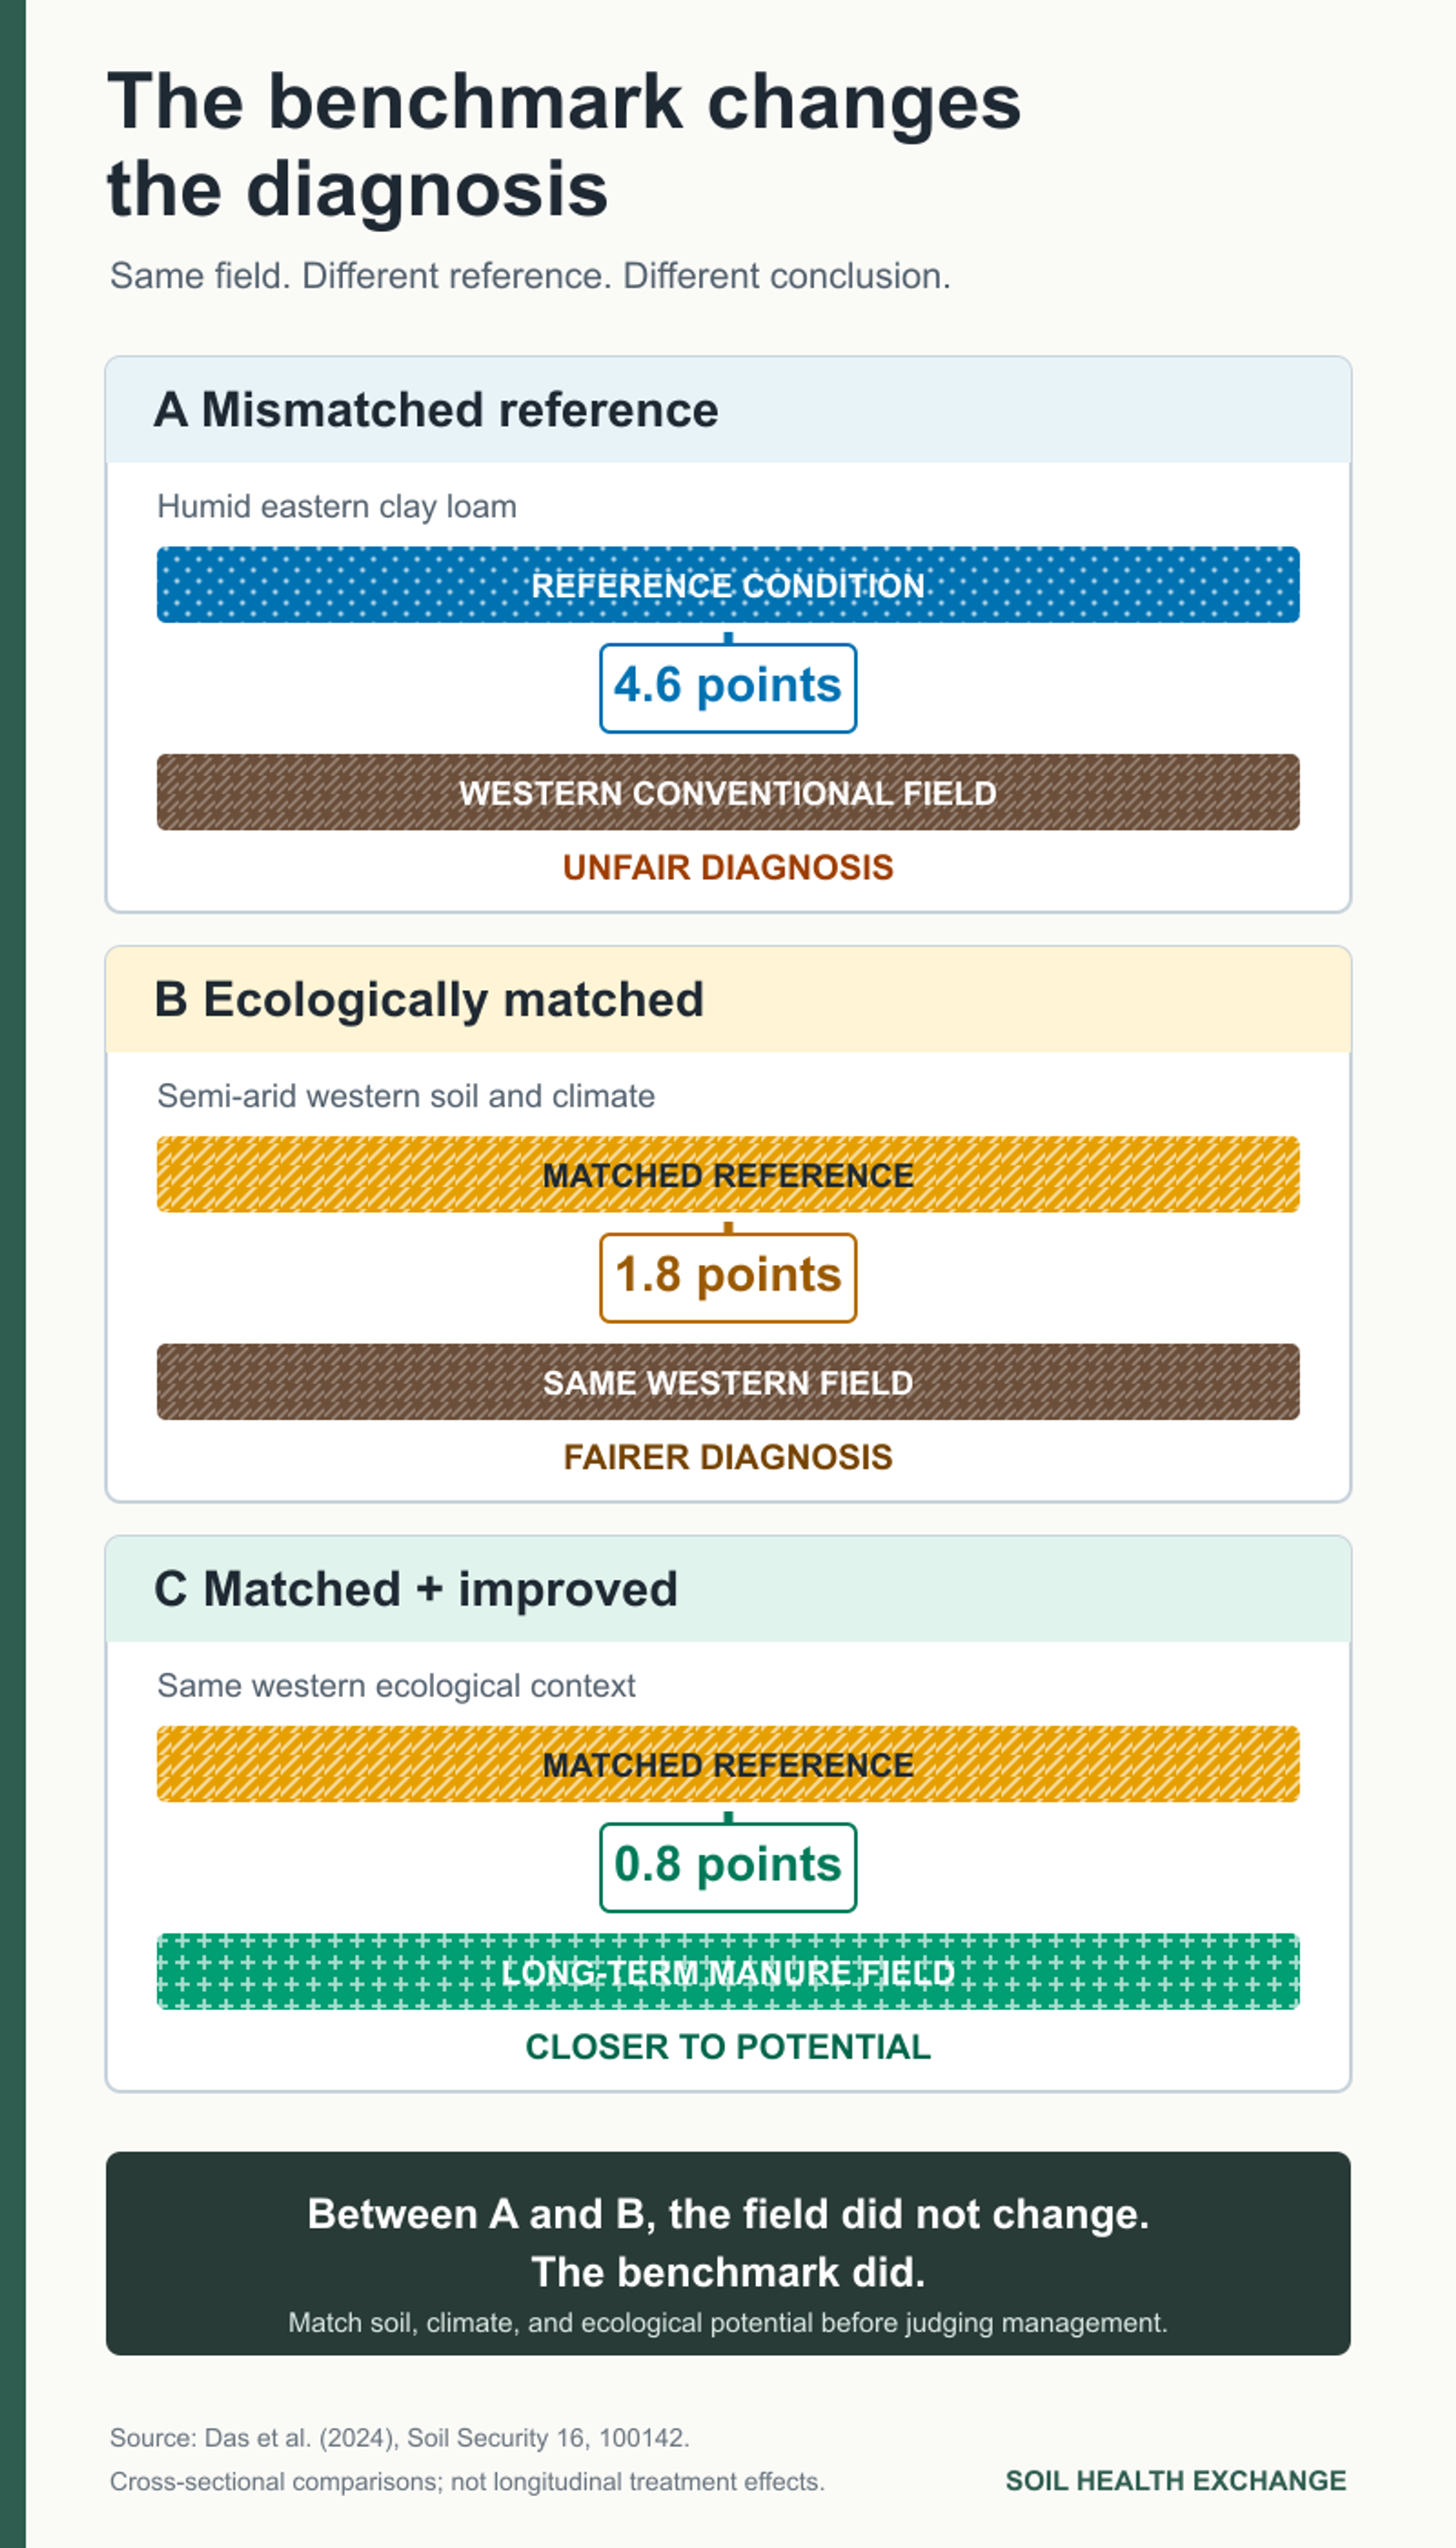
A western Nebraska field can appear 4.6 percentage points behind in soil organic matter when it is graded against a humid eastern Nebraska reference. Compare that same field with an ecologically matched western reference, and the gap is 1.8 points. The soil did not change. The benchmark did.
That is why this question has stayed with me since 2020: improving soil health compared with what?
Working across Nebraska, I met farmers who were trying to do right by their soil but could not get a fair answer from a soil-health score. A grower could hand me a test and ask, “Is this good?” Yet a number by itself could not tell us whether the soil was close to its potential, whether management was helping, or whether the target belonged to a completely different soil and climate.
The problem was not a lack of recommended practices. It was the fairness of the measurement.
Two soils under similar management can behave very differently because their attainable ranges differ. Texture, mineralogy, precipitation, potential evapotranspiration, landscape position, and ecological history all shape the starting point and the ceiling before management enters the picture.
Our research group began treating soil health less like a universal score and more like a distance from an ecologically relevant reference. That idea now runs through four peer-reviewed papers: Soil Health Gap, Cropland Reference Ecological Units, ecological reference-site selection, and a Two-Tier assessment framework.
The idea in one sentence
Measure a practical core set of indicators, interpret each result against an ecologically matched reference, and track whether the gap closes under management.
30
indicators assessed
53
composite samples from 16 sites
4
Tier 1 core indicators
88.6%
variation explained by the first 3 principal components
Those figures come from our now-published Two-Tier study of 53 composite soil samples collected across 16 native reference sites in two Nebraska Major Land Resource Areas. The analysis started with 30 indicators and identified four that carried distinct, practical information: organic matter, pH, nitrate-N, and bulk density. When the analysis was repeated with those four indicators, the first three principal components explained 88.6% of the variation within the reduced four-indicator dataset.
The four measurements form Tier 1: a consistent core that can be repeated without asking every farm to pay for a 30-indicator panel. Tier 2 supplies the context by interpreting each result against the reference range for a comparable soil and climate. The value is not four numbers in isolation; it is consistent measurement paired with a fairer benchmark.
The simplest way to see why the second tier matters is to hold the field constant and change only the reference.
Click to expand
The benchmark changes the diagnosis. Panels A and B use the same western field; only the reference changes. This side-by-side comparison shows why reference choice belongs in soil-health interpretation. Source: Das et al. (2024).
Part 1: Soil Health Gap — turning “improvement” into a measurable idea
We defined soil health improvement as the closing of a gap:
Soil Health Gap (SHG) = soil health under a reference condition − soil health under the managed (cropland) condition.
In equation form:
SHGₓ = (SH)ₙ − (SH)ₘ
where (SH)ₙ is the reference condition, (SH)ₘ is the managed condition, and x is the indicator of interest. This direct subtraction is intuitive for indicators where more generally means better, such as soil organic carbon within a relevant range. Indicators with the opposite direction, such as excessive bulk density, require direction-aware scoring rather than blindly applying the same sign.
A gap becomes most useful when it is measured consistently over time. Sample at the same depth, in a comparable season, and with the same laboratory method; then read the change alongside management records and farm outcomes. One test starts the conversation. A comparable series shows whether the field is moving toward or away from its reference condition.
The underlying carbon loss is well established. A synthesis of cultivated soils estimated that conversion from native vegetation reduced soil carbon by roughly 20–40%, with a central estimate near 30% (Davidson & Ackerman, 1993). The Soil Health Gap gave us a practical way to ask how much of that distance remained in a particular agroecosystem.
Then reality pushed back. Every soil is different, and its texture and environment set its potential.
Part 2: Why statewide comparisons can misdiagnose a field
Within a few sampling rounds, the problem was obvious. Comparing a sandy, semi-arid soil in western Nebraska with a humid, fine-textured soil in eastern Nebraska is not a fair test of management—even when both soils are functioning well in their own settings.
Each soil has a different attainable range. A sandy soil under semi-arid conditions may never hold as much carbon or form aggregates like a humid, fine-textured soil. The farmer is not failing; the comparison is. A soil's carbon-storage capacity is shaped first by minerals and texture, then by climate (Georgiou et al., 2022).
So even though the Soil Health Gap was the right idea, it needed one more thing:
a way to compare soils only against other soils that share the same ecological constraints. That became the Cropland Reference Ecological Unit (CREU).
Figure
The benchmark changes the diagnosis
Mismatched eastern reference vs western cropland
4.6 percentage-point SOM gap
Matched western reference vs conventional
1.8 percentage-point SOM gap
Matched western reference vs long-term manure
0.8 percentage-point SOM gap
Comparisons from Das et al. (2024). Grading western Nebraska cropland against a mismatched eastern reference produces a 4.6-point gap. Within the correct ecological context, the gap is 1.8 points for conventional cropland and 0.8 for long-term manure management. The comparison shows how strongly the chosen benchmark shapes the diagnosis.
Click to expand
This is more than a statistical adjustment. In our 2024 analysis, the mismatched reference made western conventional cropland look 4.6 SOM percentage points behind. A matched comparison put that gap at 1.8 points. Long-term manure management was 0.8 points from the matched reference. Benchmark choice changed the diagnosis—and could therefore change the advice, incentive payment, or perception of farmer performance.
Part 3: CREU — making comparisons fairer by matching potential
CREU classifies land into units with similar soil-forming and climatic context, so that reference benchmarks actually mean something.
For practical benchmarking, a CREU can be delineated with three layers: the Major Land Resource Area (MLRA), soil texture, and a climatic moisture zone.
That moisture zone should not treat annual precipitation as a universal quantity. The same inch of rain can mean something very different where atmospheric water demand is higher, so precipitation is better interpreted relative to potential evapotranspiration (PET)—often expressed as an aridity index, or precipitation divided by PET.
Ecological Site Descriptions and State-and-Transition Models then help identify the appropriate reference plant community within that matched land context. Put simply, the CREU defines the fair comparison area; ecological information helps identify the reference condition.
The 2022 CREU paper demonstrated the method in Nebraska MLRA 67A and identified 45 CREUs. It turned a general warning—‘context matters’—into a repeatable land-classification approach. The next step is to extend and calibrate that approach with regional partners and reference data.
Now we had two of the pieces: a measurable definition of “improvement” (a shrinking gap), and a fairness unit that controls for ecological potential.
But the hardest operational question was still open: where do the reference sites actually come from?
Part 4: Reference sites — the fence-line problem (and why it matters)
Everyone reaches for fence lines, and I understand why — they look undisturbed, they’re easy, and they’re right there. But fence lines are often poor references. They can be shaped by runoff, dust and nutrient drift, compaction, invasion, and a long, invisible disturbance history; in windy regions, aeolian processes rework them outright.
More fundamentally, a fence line doesn’t necessarily represent the productive ecological potential of that land.
So we asked a different question: how do you identify a reference condition that is ecological, defensible, and repeatable?
This is where State-and-Transition Models (STMs) became essential. Instead of guessing, we used STMs and Ecological Site Descriptions to identify the reference plant community and the expected functional state for a given ecological context.
Reference selection then becomes a method, not a convenience: match soil, ecological site, and vegetation reference state, then sample it systematically alongside a paired managed site from the same CREU.
Our measured comparison showed why this matters. One disturbed fence-line reference had 2.7% SOM — the same as nearby long-term-manured cropland — while the ecological reference was 0.7 points higher. A convenient reference could therefore make an altered site look as though it had already reached its potential.
That gave us the third piece: a reference isn’t a location you settle for. It’s an ecological state you define.
So far the system looked like this — define improvement as closing a gap (SHG), define the comparison unit by potential (CREU), and define the reference ecologically (STM/ESD).
Click to expand
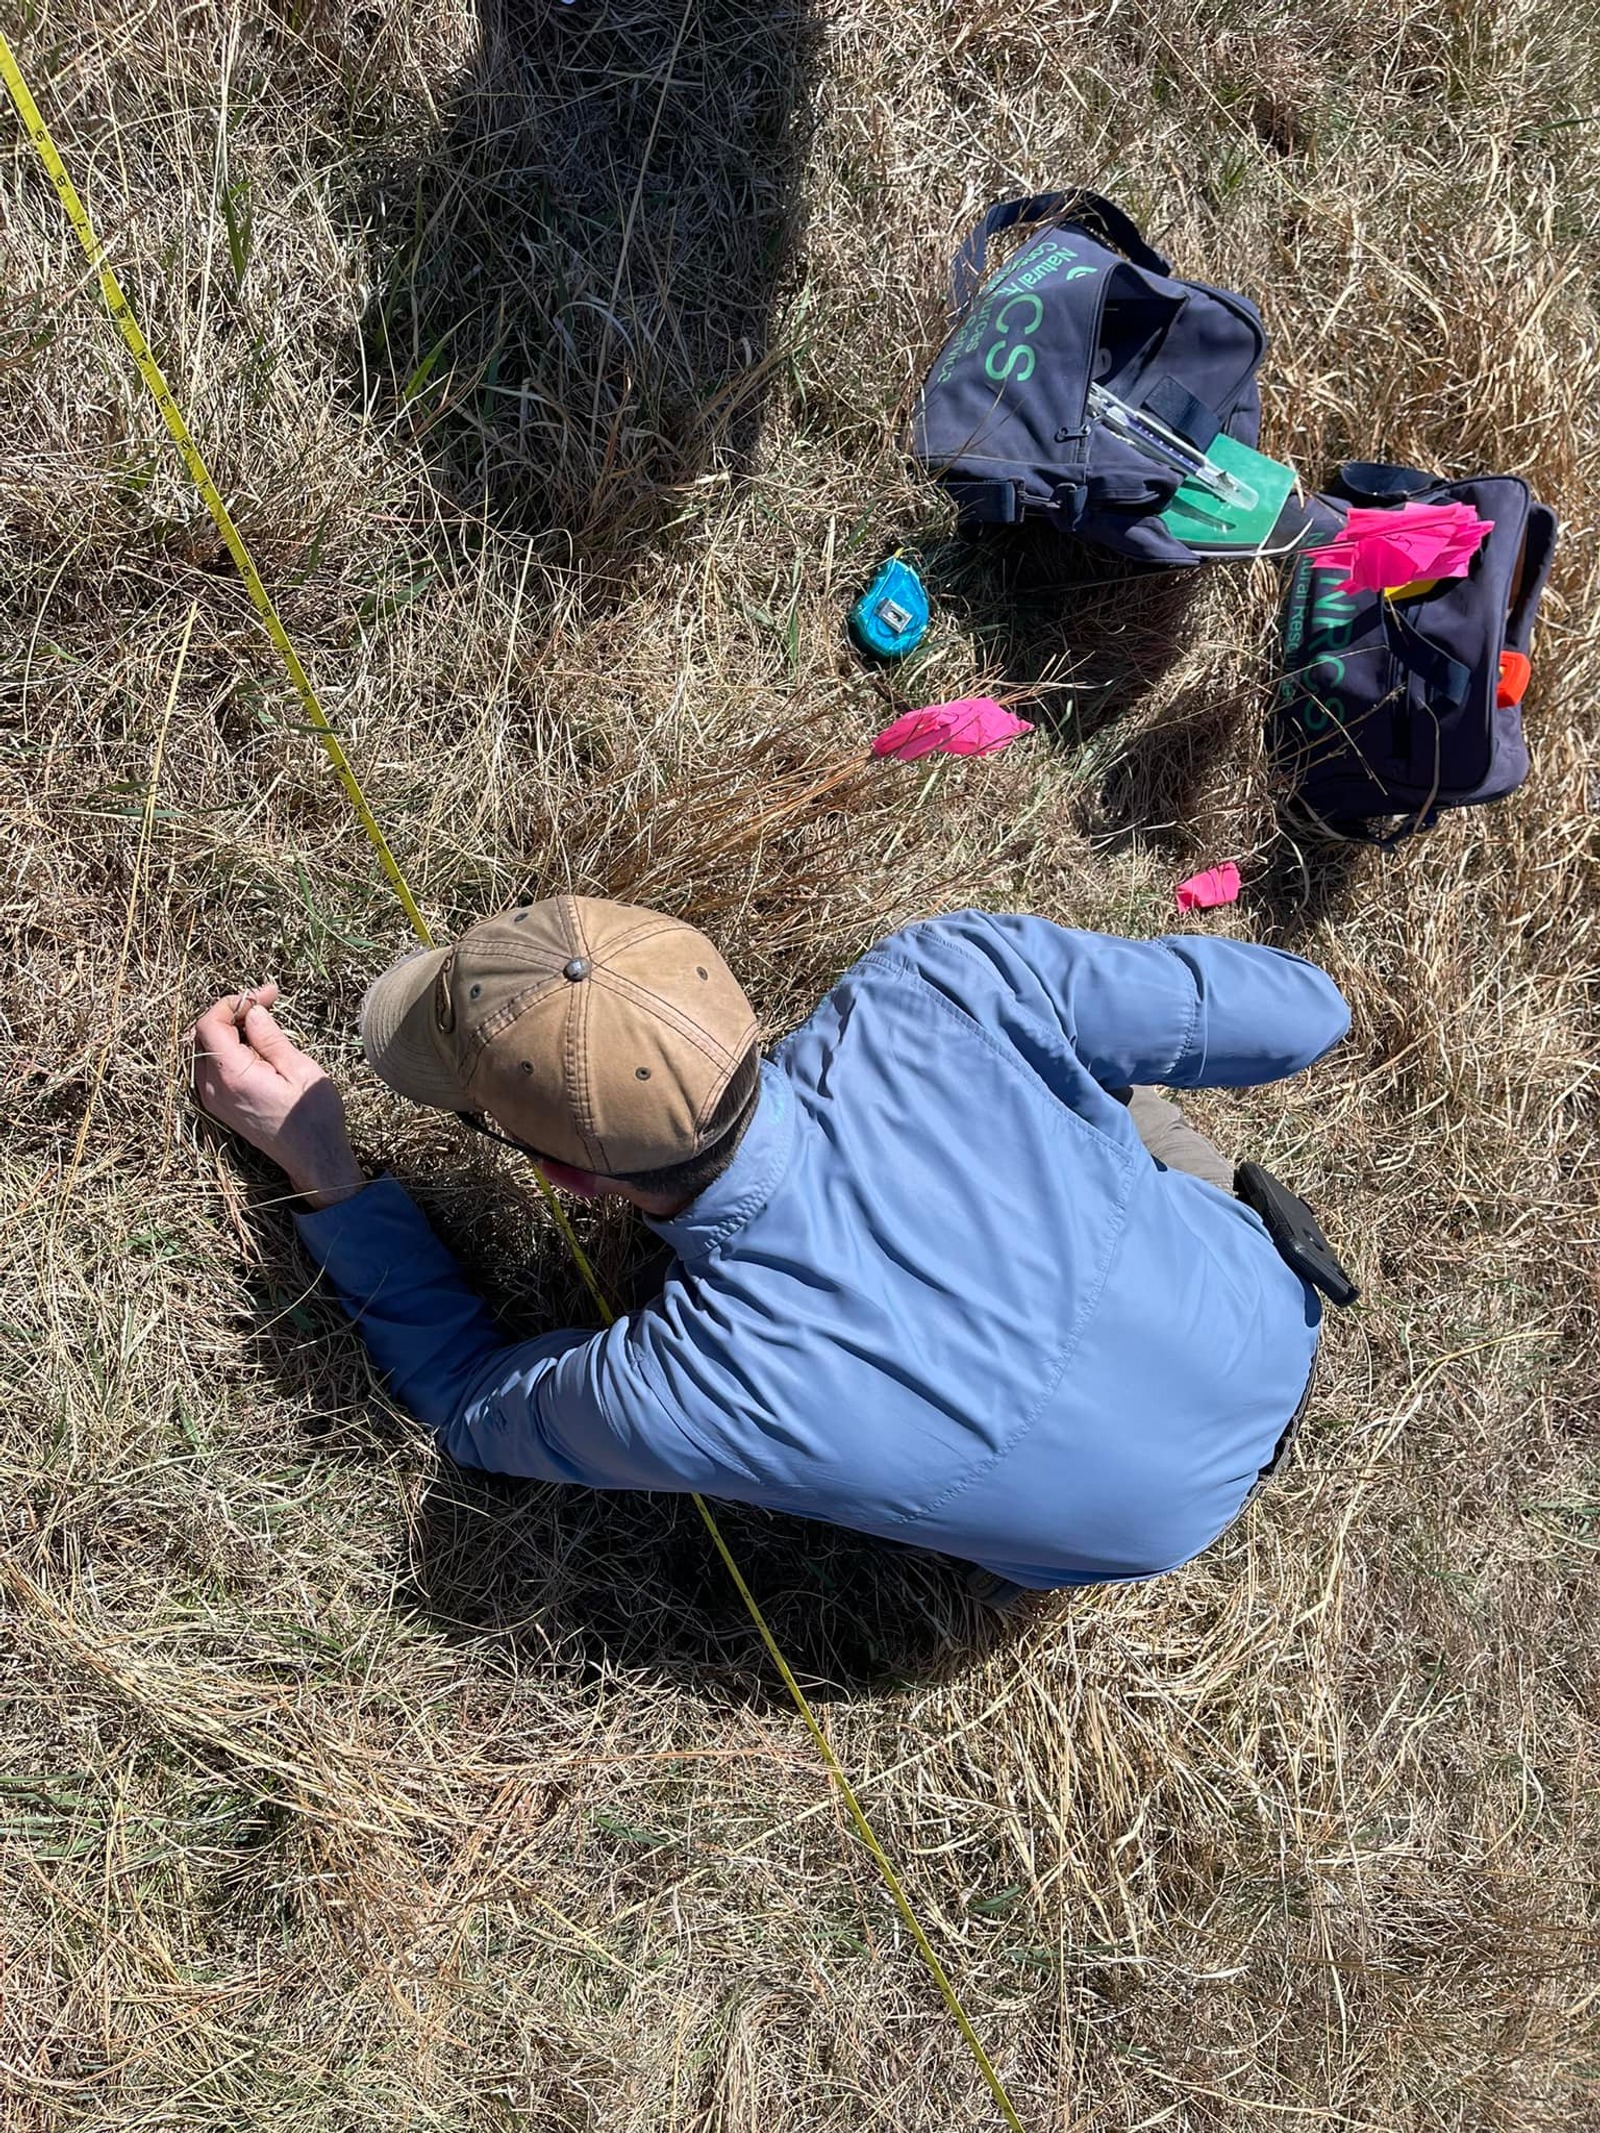
Reference-site selection includes verifying the ecological plant community in the field, not simply sampling the nearest fence line.
Then we hit the fourth problem — the one farmers and researchers both feel immediately.
Part 5: What do we measure, realistically?
Soil health has too many indicators to measure everything, everywhere. Ask a farmer or program to repeat a 25- to 40-indicator panel, and cost and complexity quickly become the limiting factors. The practical question is which measurements carry distinct information and can be repeated consistently. Other national work has reached a similar conclusion: after evaluating more than 30 indicators across 124 North American sites, the Soil Health Institute recommended three core measurements (Bagnall et al., 2023).
Our peer-reviewed Two-Tier framework, published in Agrosystems, Geosciences & Environment in 2026, separates measurement from interpretation.
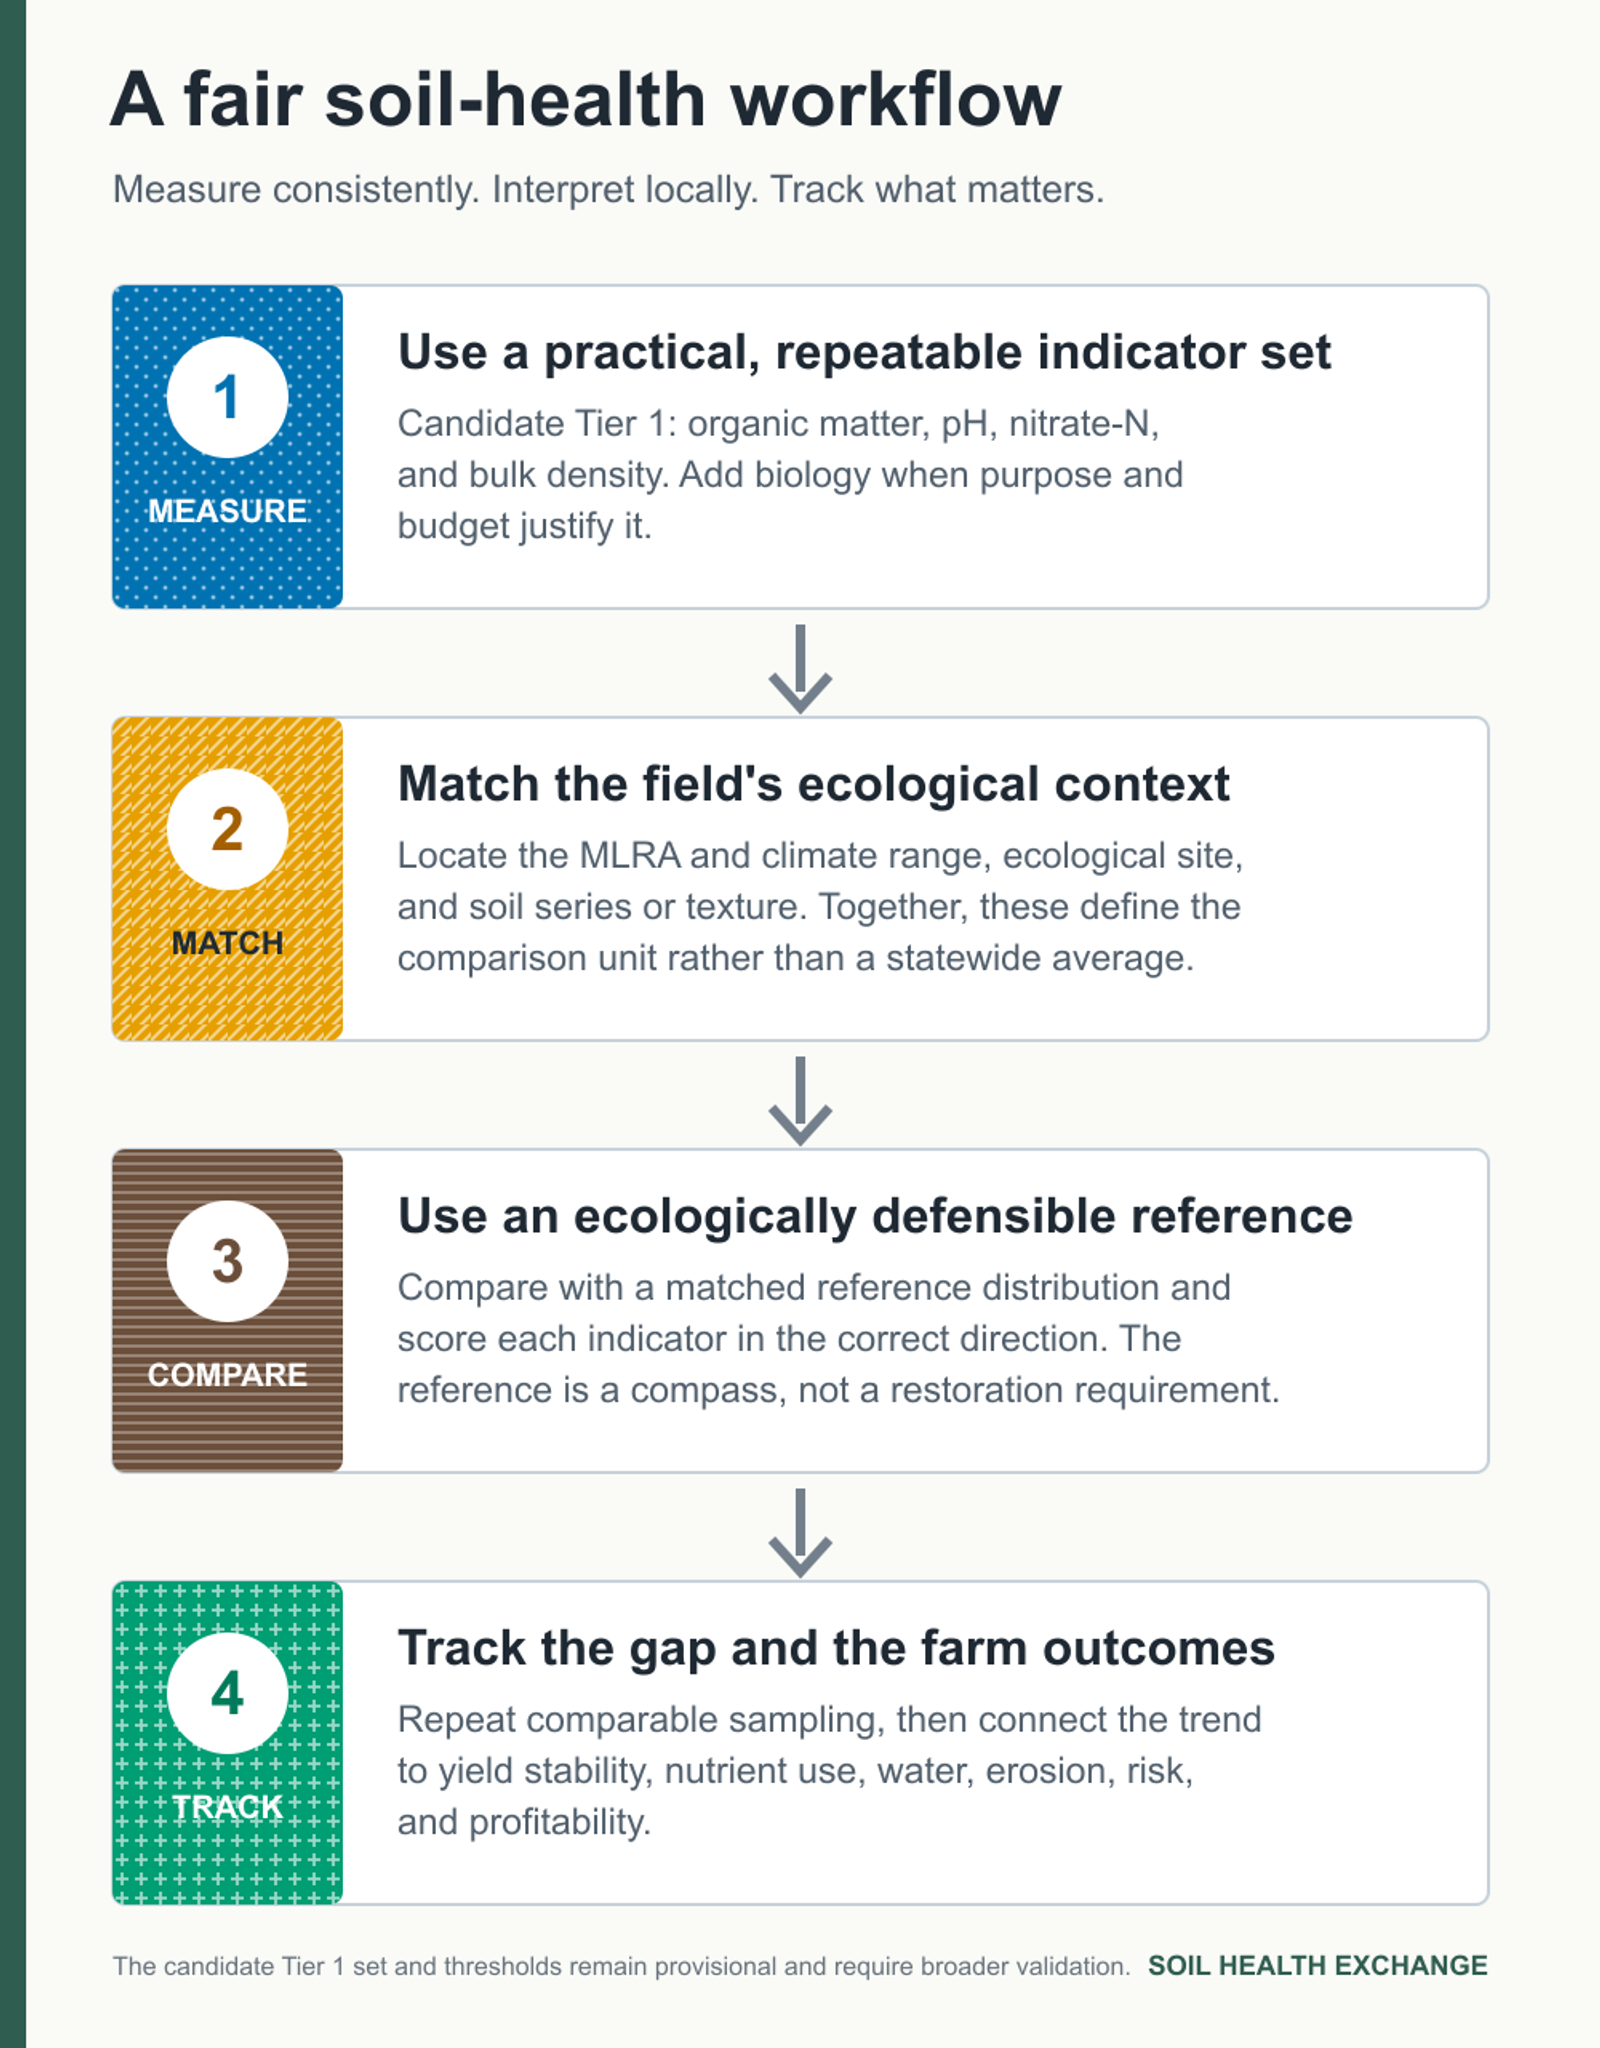
Tier 1 is the repeatable core: organic matter, pH, nitrate-N, and bulk density. Tier 2 interprets those same measurements against CREU-based reference distributions. A fungal-to-bacterial ratio can be added as an optional Tier 1+ biological measure when the question and budget justify it.
The study assessed 30 indicators using 53 composite soil samples collected across 16 native reference sites in two Nebraska MLRAs. Statistical screening identified the four Tier 1 indicators as representatives of carbon, chemical environment, nutrient availability, and physical condition. When principal component analysis was repeated on that four-indicator set, the first three principal components explained 88.6% of the variation within the reduced four-indicator dataset.
How to use the core set
Treat organic matter, pH, nitrate-N, and bulk density as a practical first layer measured with consistent methods. Add a biological indicator when it serves a clear purpose. Then use Tier 2 to interpret the values within their soil, climate, sampling, and management context.
Tier 2 draws its interpretation ranges from ecological reference distributions, using the 25th percentile, median, and 75th percentile within each available MLRA × texture context. These ranges work as reference envelopes: they show what is typical for a comparable native soil and help locate the size and direction of a cropland's gap.
Click to expand
A fair soil-health workflow: measure consistently, interpret locally, and track outcomes that matter to the farm. Tier 1 standardizes measurement; Tier 2 supplies ecological context.
This matters because “good organic matter” is not a universal number.
In our published reference-site comparison, average organic matter was about 1.5% in one sandy, semi-arid context and 6.2% in a humid clay-loam context. Each value made sense within its own ecological setting.
Figure
“Good” organic matter depends on context
Sandy, semi-arid
1.5 % OM (reference)
Humid clay loam
6.2 % OM (reference)
Reference organic matter from paired Nebraska sites: ~1.5% in a sandy, semi-arid MLRA vs 6.2% in a humid clay-loam MLRA. Both are healthy for their own potential — same word, different number. Source: Das et al. (2024), Soil Security.
Click to expand
Same word. Different number. Same ecological truth.
A quick example: the carbon gap becomes a decision-ready number
Take one dataset from the semi-arid High Plains. SOC ran 4.4% in native grassland, 2.2% under no-till, 1.8% under conventional tillage, and 0.7% in exposed subsoil.
Figure
Soil organic carbon by management (Nebraska Panhandle)
Native grassland
4.4 % SOC
No-till
2.2 % SOC
Conventional till
1.8 % SOC
Exposed subsoil
0.7 % SOC
One High Plains dataset (Scotts Bluff County, Nebraska). Native grassland provides the ecological reference point; the managed conditions show increasing distance from it. Source: Soil Health Gap analysis, Maharjan et al. (2020).
Click to expand
Turn those into Soil Health Gaps for carbon and the story sharpens: SHG_C (no-till) ≈ 44 − 22 = 22 g C kg⁻¹; SHG_C (conventional till) ≈ 44 − 18 = 26 g C kg⁻¹; SHG_C (exposed subsoil) ≈ 44 − 7 = 37 g C kg⁻¹.
Figure
Soil Health Gap for carbon — distance from the soil's own potential
No-till
22 g C/kg
Conventional till
26 g C/kg
Exposed subsoil
37 g C/kg
SHG_C = native SOC − managed SOC, same dataset. A smaller bar means management has closed more of the gap. Reference: Maharjan et al. (2020), Global Ecology and Conservation.
Click to expand
Now the farmer doesn’t just hear “your SOC is low.” They hear: this is the size of the gap relative to your soil’s potential — and that gap can be tracked, up or down, as management changes. That’s a measurable story of degradation and recovery.
How to use this idea on a farm
Most farmers will not find a CREU label on a laboratory report today. That is okay. The useful first step is to ask what comparison sits behind the score. A target should reflect the soil, climate, landscape position, and production system closely enough to guide a real decision.
When you read a soil-health result, ask four questions:
What was this target built from? — a national average, similar farms, or an ecological reference?
Does that comparison fit this field? — consider texture, climate, drainage, landscape position, and crop system.
Was the sample collected comparably? — depth, timing, laboratory method, and recent management all matter.
Is the field moving in the right direction? — track the gap alongside yield stability, nutrient use, water movement, erosion, cost, and risk.
A native reference is a compass, not a prescription to return every field to native vegetation. For working cropland, a useful pathway is hierarchical: compare first with similar farms using feasible practices, then ask whether additional management can move the field closer to its ecological potential.
That changes the conversation from ‘Did I pass?’ to ‘What is realistic here, what direction am I moving, and what is the next useful step?’
What this changes for advisers and programs
A fair assessment can be both consistent and local. The framework separates those jobs so a program does not have to choose between them:
Use a common Tier 1 measurement set and consistent sampling protocols.
Match interpretation to the field's soil and climate context through Tier 2.
Select reference sites from the intended ecological state, not simply the nearest undisturbed-looking fence line.
Track soil indicators beside outcomes that matter to the farm, including productivity, water, nutrient efficiency, profitability, and risk.
This matters for incentives and carbon markets because the benchmark influences who appears to improve. Ecologically matched targets help programs reward change created through management instead of geography or inherited soil stocks. In plain terms, the baseline should distinguish new improvement from what would have existed anyway (Kannegieter & Medlock, 2026).
How the four papers build the framework
One practical question led to the next:
1. Soil Health Gap (2020): What counts as improvement?
The first paper defined improvement as closing the distance between managed soil and a relevant reference condition. It gave us a number that can be followed through time instead of a generic pass-or-fail score.
2. CREU (2022): Which soils are fair to compare?
The second paper created a land-classification approach for grouping soils with similar potential. It made the benchmark more local by accounting for soil-forming and climatic context.
3. Reference-site selection (2024): What should set the benchmark?
The third paper made reference selection repeatable through ecological sites, state-and-transition models, soil, and precipitation. The nearest fence line was no longer enough; the reference needed an ecological reason for being chosen.
4. Two-Tier framework (2026): How can assessment stay practical and fair?
The fourth paper joined a four-indicator measurement core with CREU-based interpretation. It keeps the laboratory list manageable while allowing the meaning of each result to change with ecological context.
Seen together, the four papers move from defining the problem to a practical assessment architecture. The next work is to expand the reference network and test the framework across more working farms, regions, seasons, management systems, and outcomes.
Where this goes next
Publication is an important step; usefulness on working farms is the larger goal. Soil Health Exchange can help move the framework from a research architecture into a practical, transparent tool.
Digitize CREU — a map layer that identifies the CREU for any parcel from geospatial inputs: MLRA, soil texture or series, and an aridity zone based on precipitation relative to potential evapotranspiration.
Build reference distributions for each CREU — the reference-based thresholds that drive Tier 2 interpretation.
Test Tier 1 on working farms — pair reference sites, cropland, management records, and repeated measurements to see how the core indicators respond through time.
Make it farmer-usable — a grower enters location, soil type/texture, and a few lab values (OM, pH, NO₃-N, BD), and gets back:
“This is your CREU.”
“These are your reference-informed thresholds.”
“This is your soil health gap.”
“And here’s what it implies — the management pathways that typically close that gap in your context.”
Connect scores to consequences — test whether smaller gaps predict yield stability, nutrient-use efficiency, greenhouse-gas outcomes, water quality, and farm profitability.
The broader field is moving in the same direction. Production-environment benchmarks in New York stratify results by texture and cropping system, while the national SEMWISE model adjusts indicator expectations for clay and climate. These approaches are complementary: production data can define what is currently attainable; ecological references can show the longer-term potential and the distance still remaining.
That is the goal: simple measurement, local interpretation, and a target that helps rather than judges. Soil health does not need one universal scorecard. It needs a consistent way to ask a fairer question.
Maharjan, B., Das, S., & Acharya, B. S. (2020). Soil Health Gap: A concept to establish a benchmark for soil health management. Global Ecology and Conservation, 23, e01116. doi.org/10.1016/j.gecco.2020.e01116
Das, S., & Maharjan, B. (2022). Cropland Reference Ecological Unit: A land classification unit for comparative soil studies. Ecological Indicators, 144, 109468. doi.org/10.1016/j.ecolind.2022.109468
Das, S., Hird, A., Maharjan, B., Stephenson, M., & Kariyawasam, L. (2024). Reference site selection based on state-and-transition models for soil health gap evaluation within cropland reference ecological units. Soil Security, 16, 100142. doi.org/10.1016/j.soisec.2024.100142
Das, S., Gamage, L. K. H., Stephenson, M., Acharya, U., Daigh, A. L. M., & Maharjan, B. (2026). A two-tier, reference-informed framework for soil health assessment: Minimum indicator sets and ecologically dynamic thresholds. Agrosystems, Geosciences & Environment, 9, e70449. doi.org/10.1002/agg2.70449
Supporting literature
Davidson, E. A., & Ackerman, I. L. (1993). Changes in soil carbon inventories following cultivation of previously untilled soils. Biogeochemistry, 20(3), 161–193. doi.org/10.1007/BF00000786
Georgiou, K., et al. (2022). Global stocks and capacity of mineral-associated soil organic carbon. Nature Communications, 13, 3797. doi.org/10.1038/s41467-022-31540-9
Bagnall, D. K., et al. (2023). A minimum suite of soil health indicators for North American agriculture. Soil Security, 10, 100084. doi.org/10.1016/j.soisec.2023.100084
Amsili, J. P., van Es, H. M., Aller, D. M., & Schindelbeck, R. R. (2023). Empirical approach for developing production environment soil health benchmarks. Geoderma Regional, 34, e00672. doi.org/10.1016/j.geodrs.2023.e00672
Deel, H. L., Moore, J. M., & Manter, D. K. (2024). SEMWISE: A national soil health scoring framework for agricultural systems. Applied Soil Ecology, 195, 105273. doi.org/10.1016/j.apsoil.2024.105273
Cassman, N. A., et al. (2025). A purpose-led framework for soil health assessment. Soil Science Society of America Journal. doi.org/10.1002/saj2.70144
Kannegieter, B., & Medlock, K. B. III (2026). Additionality constrains investment in carbon sequestration. npj Sustainable Agriculture, 4, 40. doi.org/10.1038/s44264-026-00155-8
Written by
Saurav Das
Soil Scientist
#Soil Health#Soil Health Benchmarking#Soil Health Gap#Creu#Soil Testing#Ecological Reference#Agricultural Policy#Carbon Markets
Scholarly record
References & Citation
Source material for every claim in this article, plus a citation-ready record for reference managers and scholarly indexes.
Cite this
Reference this work
SHE-ART-2026-0030
Saurav Das (2026). A Fairer Way to Set Soil Health Targets. Soil Health Exchange. SHE-ART-2026-0030. https://soilhealthexchange.com/cite/SHE-ART-2026-0030
Das, S. (2026). A Fairer Way to Set Soil Health Targets. Soil Health Exchange. https://soilhealthexchange.com/blog/why-your-soil-health-targets-might-be-unfair-and-how-to-fix-them
More citation formats
MLA
Das, Saurav. "A Fairer Way to Set Soil Health Targets." Soil Health Exchange, 2026-02-01, https://soilhealthexchange.com/blog/why-your-soil-health-targets-might-be-unfair-and-how-to-fix-them.
Chicago
Das, Saurav. "A Fairer Way to Set Soil Health Targets." Soil Health Exchange. Published 2026-02-01. https://soilhealthexchange.com/blog/why-your-soil-health-targets-might-be-unfair-and-how-to-fix-them.
Citation metadata is provided for discovery tools and reference managers. Inclusion in external scholarly indexes is not guaranteed.
Discussion (2)
AH
Aaron Hird7 months ago
This is an awesome review and assessment of the continuum of this project over the course of these various publications and research efforts. I think another key point to highlight is the ability to formulate the Hierarchy of Land Use and Management associated with various quantifications of the dynamic properties and soil functions which are assessed. I think this especially highlights how a multi-disciplinary investigation can result in synergy in discovering new knowledge.
SD
Saurav Das6 months ago
Thats true. This project was the best example of collaboration and interdisciplinary work.


This is an awesome review and assessment of the continuum of this project over the course of these various publications and research efforts. I think another key point to highlight is the ability to formulate the Hierarchy of Land Use and Management associated with various quantifications of the dynamic properties and soil functions which are assessed. I think this especially highlights how a multi-disciplinary investigation can result in synergy in discovering new knowledge.
Thats true. This project was the best example of collaboration and interdisciplinary work.