The number of crops in a rotation matters less than what each crop changes. This evidence-led guide shows how sequence, timing, functional contrast, crop legacy, economics, and operational fit determine whether a rotation actually works.
SH
By Soil Health Exchange Team||27 min read|17 reads
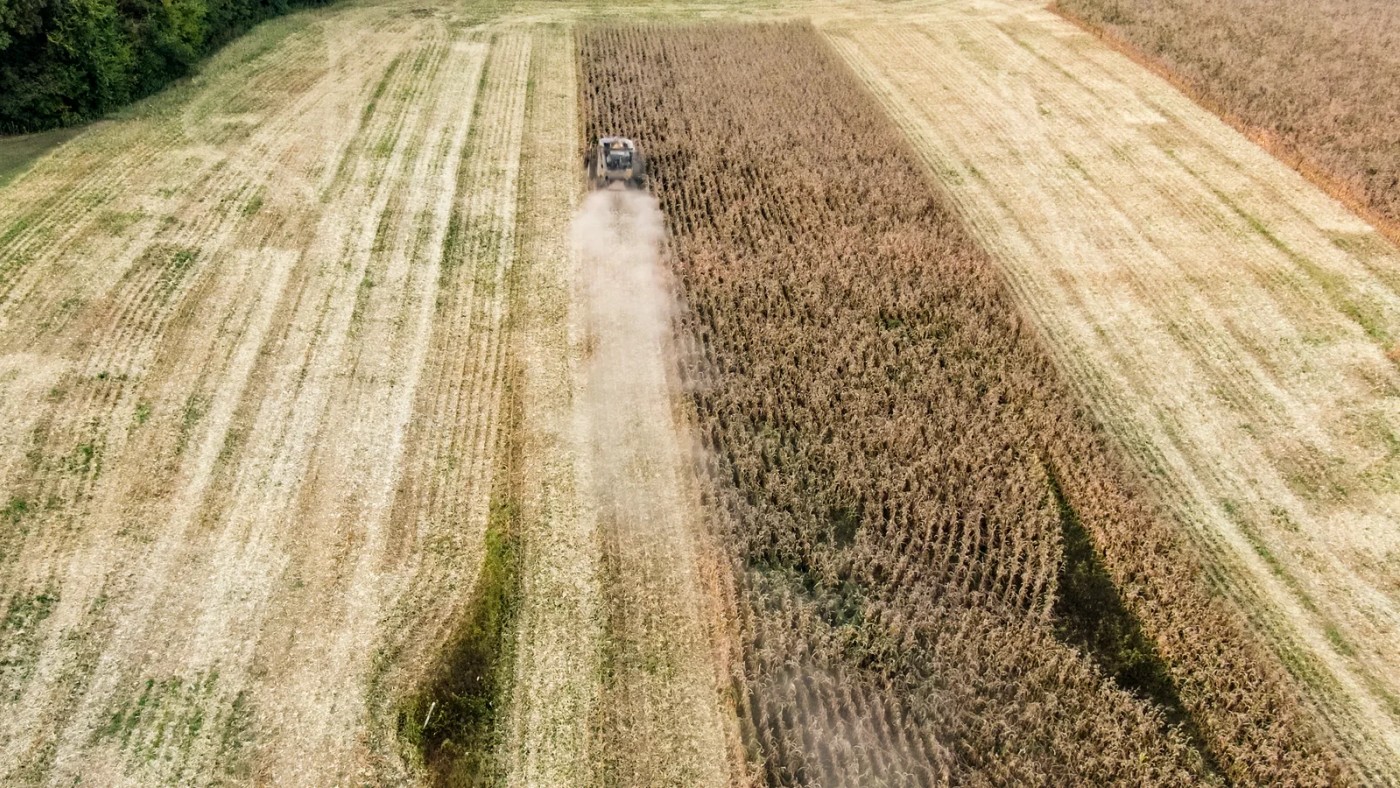
Corn harvest at Norwood Farms, Tennessee, where corn, wheat, soybean, and cover-crop phases are used in a conservation rotation. A single photograph shows one phase; performance belongs to the full sequence. — Credit: USDA NRCS photo by Lance Cheung (public domain; cropped)
The bottom line
A rotation is a timed management system, not a list of crop names. Strong rotations create deliberate contrasts in host status, planting and harvest dates, rooting, residue, nitrogen demand and supply, water use, and control tactics—while remaining marketable and operable. Research supports meaningful gains in yield resilience, weed suppression, soil carbon and microbial biomass, but the result depends on the baseline, crops, climate, rotation age, and management package. Evaluate the entire cycle per acre-year, identify the weakest transition, and test a candidate rotation with all phases represented before treating it as a recommendation.
Two rotations can each contain four crops and still behave very differently. One may alternate cool- and warm-season crops, grasses and broadleaves, shallow and deep roots, high- and low-residue phases, and several control windows. The other may repeat the same planting window, host family, herbicide pressure, rooting zone, and peak water demand under different crop names. The useful difference is the contrast each phase creates.
Begin with what each phase changes
Instead of stopping at “How many crops are in the rotation?”, ask: What problem does each phase solve? What new risk could it create? What conditions will it leave for the crop that follows?
Swipe horizontally to inspect the full figure →
Click or tap to expand the figure
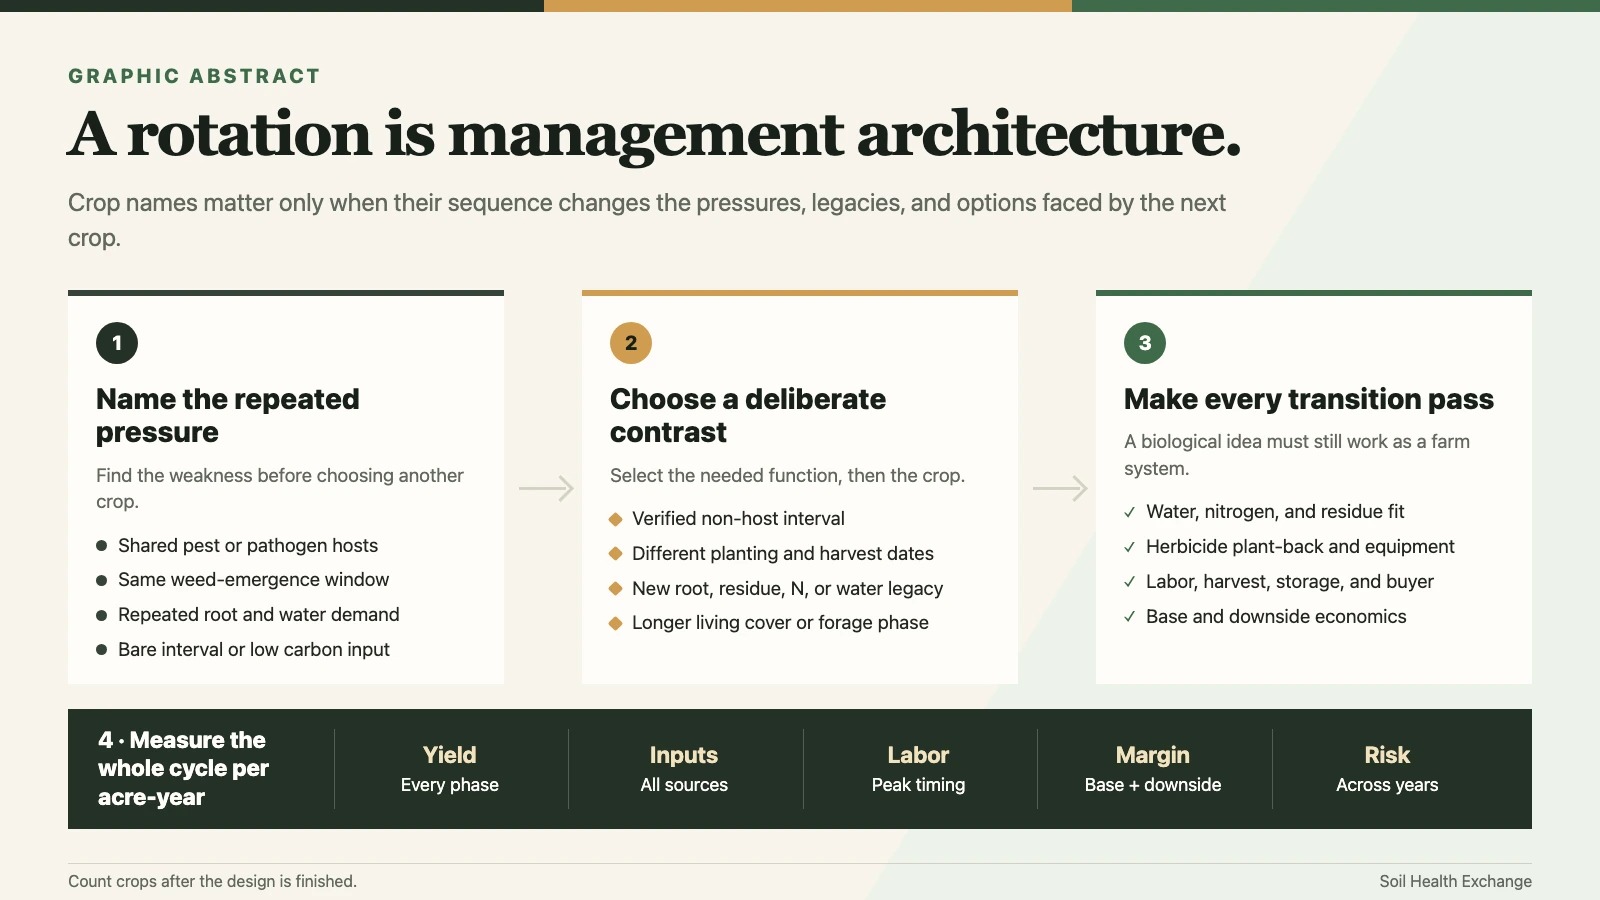
Rotation design begins with a limiting process, not a crop list. The sequence becomes defensible only after every transition passes biological, operational, and economic checks. — Figure: Soil Health Exchange
Why rotation design matters more than crop count
Crop richness is easy to count, so it often becomes a stand-in for rotation quality. But count ignores order, duration, crop function, timing, and management. A cereal followed by another cereal may carry a very different pathogen, weed, nitrogen, and residue legacy than a cereal followed by a pulse, forage, or non-host broadleaf. Reversing two crops can also change fall planting opportunity, soil-water carryover, herbicide plant-back, and the yield of the next crop.
Recent long-term evidence makes the same point statistically. Across 32 European and North American experiments, functional richness—the number of meaningfully different crop functional groups—was more consistently associated with climate resilience than species count alone. Yet a separate 16-year South Dakota experiment found that the most stabilizing weather niches did not map neatly onto familiar labels such as cool versus warm season or grass versus legume. Functional groups are therefore a better starting hypothesis than raw crop count, not a substitute for local performance data. [2][4]
Five different things often hidden inside the word diversity
Dimension
What it measures
What it can miss
Species richness
Number of crop species in the cycle
Whether crops perform similar functions or occupy the same management window
Functional richness
Contrast among cereals, legumes, oilseeds, root crops, forages, covers, and other roles
Local weather response, marketability, and exact crop sequence
Temporal diversity
Variation in planting, canopy, harvest, and fallow periods
Whether the calendar is operationally realistic
Sequence diversity
Which crop follows which, and how long a host or control tactic is absent
Longer-term effects beyond the immediate next crop
Management diversity
Changes in fertility, tillage, herbicides, cultivation, grazing, manure, and harvest
Whether the benefit came from crop choice, management, or the combined system
A defensible rotation description reports all five dimensions instead of reducing the design to one crop count.
Swipe horizontally to inspect the full figure →
Click or tap to expand the figure
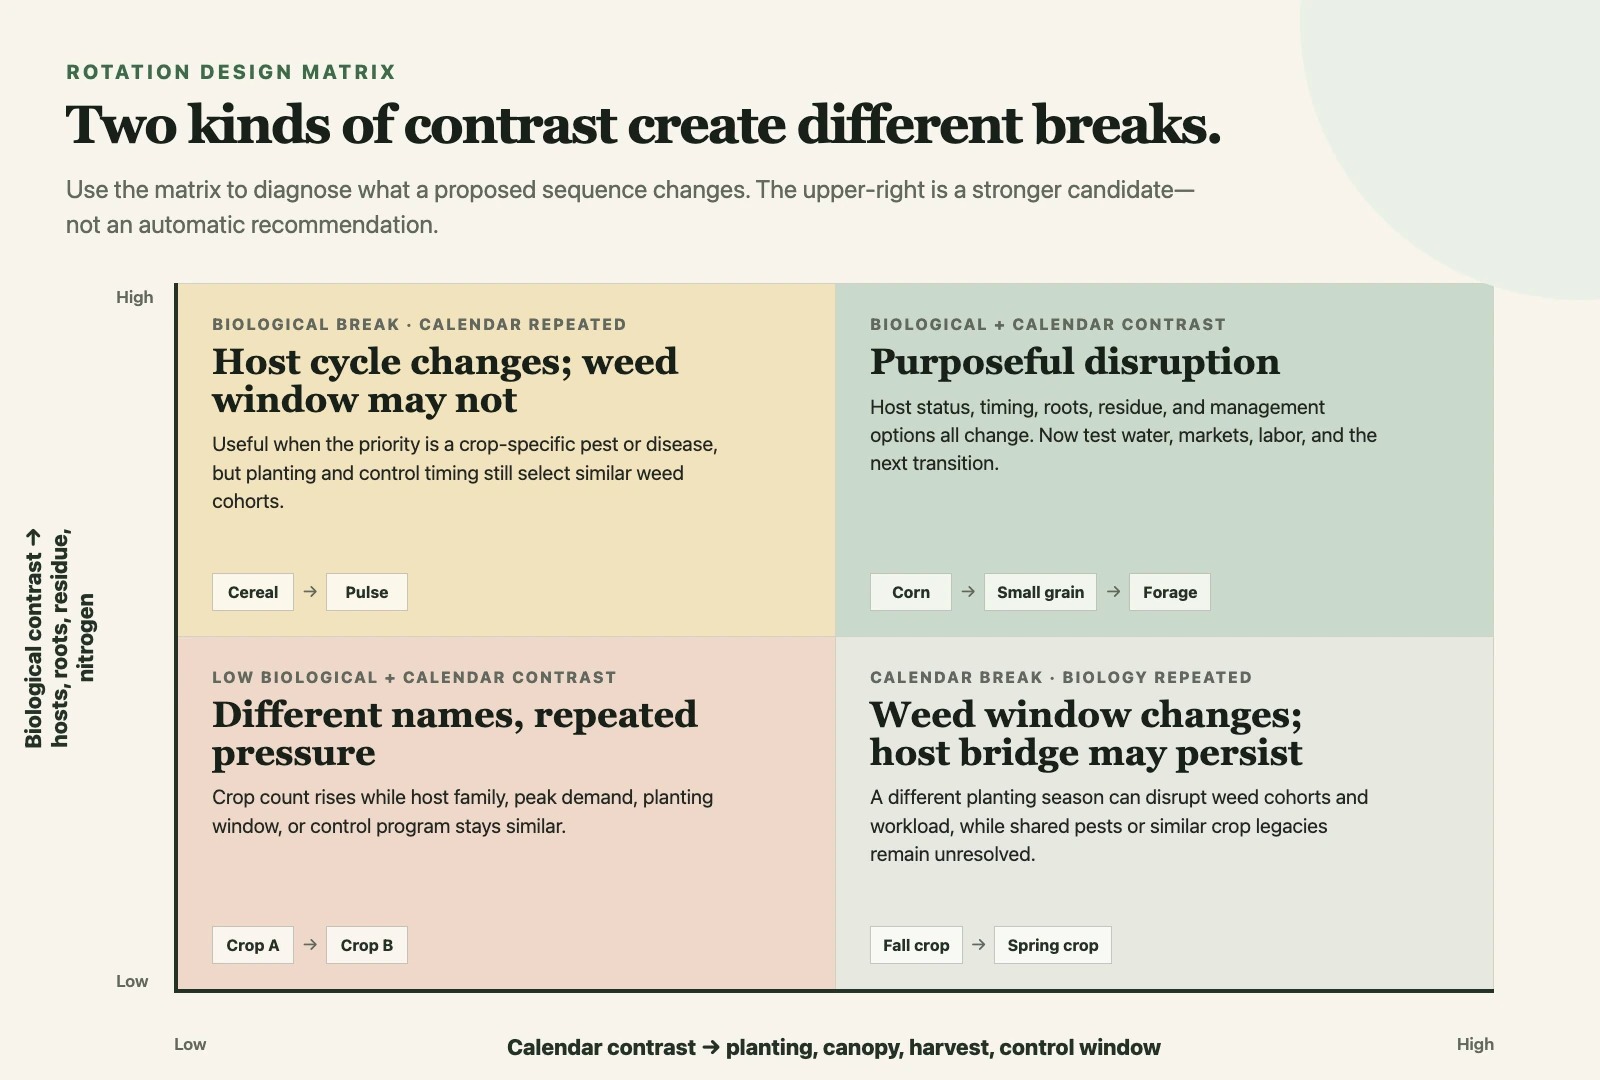
A conceptual diagnostic—not a validated score. The upper-right creates more kinds of disruption, but it remains only a candidate until crop-specific host ranges, water, sequence, markets, labor, and economics are verified. — Figure: Soil Health Exchange
What long-term studies show
Rotation research uses different comparisons: monoculture versus any rotation, cereal-only versus functionally richer rotations, or a standard two-crop rotation versus a longer one. It also reports different outcomes: the yield of one crop, average output across a complete cycle, gross crop value, net return, or soil properties. The figures below are intentionally kept with their original baselines.
Selected rotation results—with the denominator left attached
Study and scope
Result
Correct reading
Boundary
Bowles et al.: 11 North American long-term experiments, 347 site-years
At the nine sites with a credible positive maize response, the most diverse rotation yielded 7.7–80.5% more than the simple rotation; mean 28.1%. Drought-year losses were reduced 14.0–89.9%.
Established, more-complex rotations often protected maize yield, especially under stress.
The 28.1% is the mean among positive sites, not a universal average; the two most arid sites showed no gain. [1]
Costa et al.: 32 long-term experiments, 941 site-years
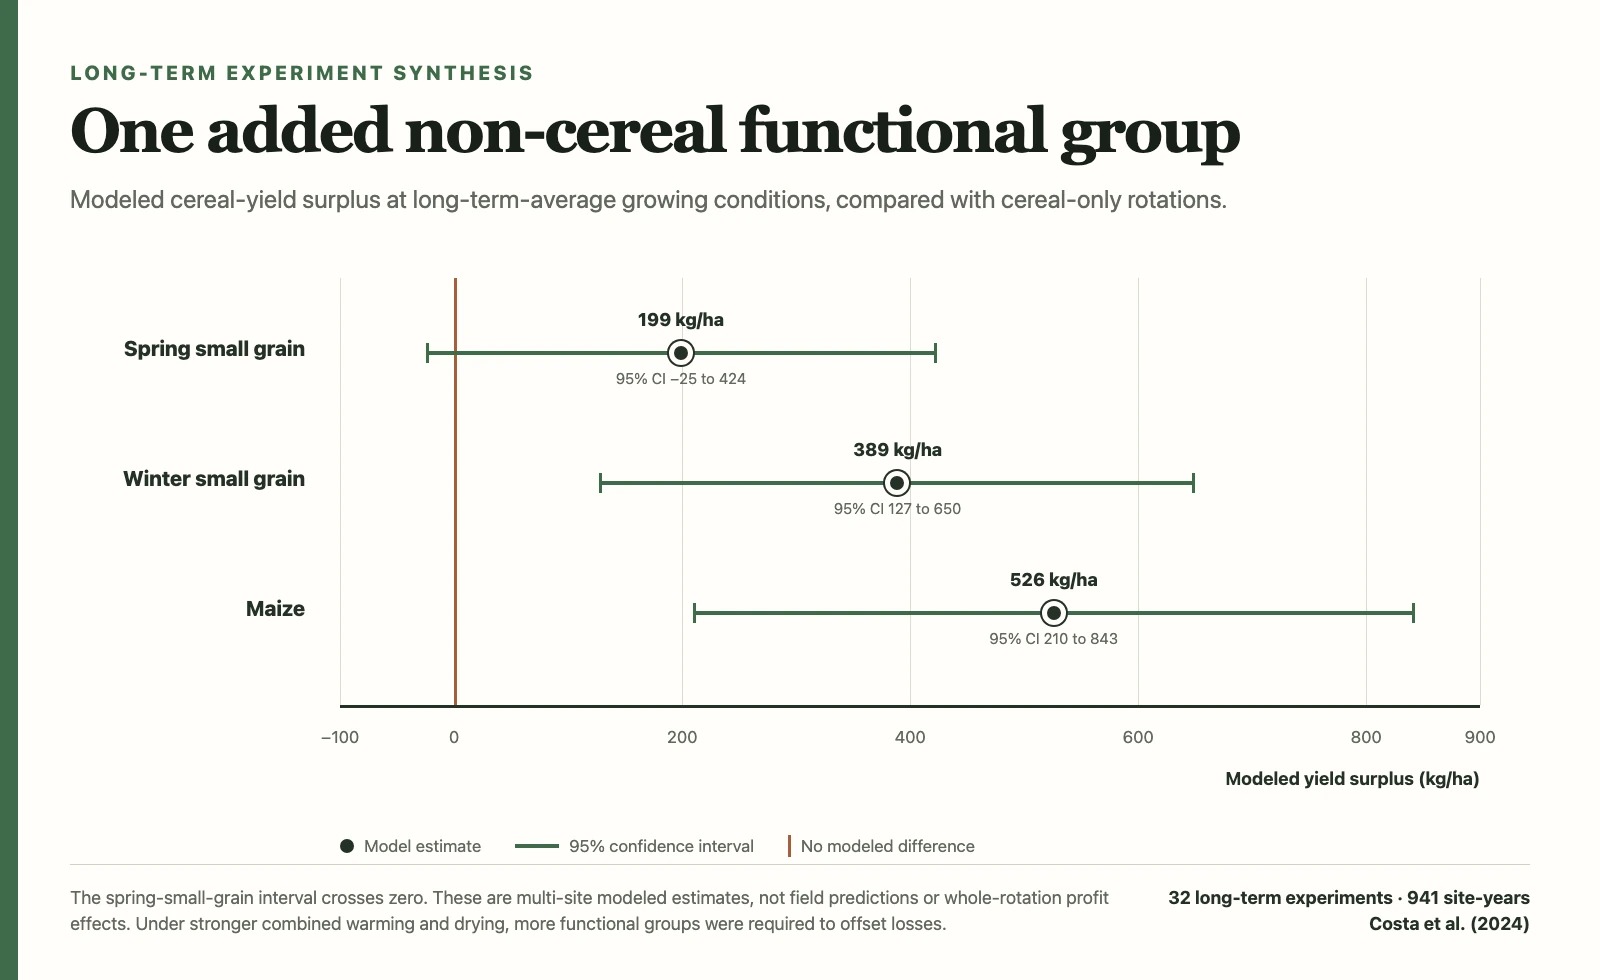
Adding one non-cereal functional group produced modeled surpluses of 199 kg/ha for spring small grains, 389 kg/ha for winter small grains, and 526 kg/ha for maize at long-term average conditions.
Functional contrast can offset part of warming-related cereal loss.
Confidence intervals differed by crop; under stronger combined heat and drying, more functional groups were required. [2]
Zhao et al.: 11,768 observations from 462 field experiments
A legume pre-crop increased the following main crop yield by 20% on average; the legume–cereal comparison was 21%.
Legumes frequently create a useful next-crop legacy.
Response declined as N fertilizer increased and varied by continent and following crop; this is not a universal fertilizer-N credit. [5]
Weisberger et al.: 298 comparisons from 54 studies
Diversified rotations reduced weed density by 49%; the 21% reduction in weed biomass was not statistically significant.
Rotations can strongly reduce the number of emerged weeds.
Density and biomass are different outcomes. Variation in planting dates mattered more than crop richness. [7]
McDaniel et al.: 122 studies
Adding at least one crop to monoculture increased total soil C 3.6%, total N 5.3%, microbial biomass C 20.7%, and microbial biomass N 26.1%.
Soil biological pools often respond more than total C or N.
The baseline was monoculture; cover-crop rotations had larger pooled C and N responses. [8]
King and Blesh: 27 sites and 169 cropping systems
Cover-cropped rotations increased estimated C input 42% and SOC concentration 6.3%; perennial-inclusive rotations increased C input 23% and SOC 12.5% versus grain-only rotations.
Carbon input and living duration help explain SOC response.
Adding a grain legume without increasing C input did not increase SOC in the grain-only comparison. [9]
Mudare et al.: 3,663 paired observations from 738 experiments
Versus continuous monoculture, legume pre-crops increased following-crop yield 23% and non-legumes 16%; a smaller 609-comparison sequence dataset showed 14–27% gains in total yield, nutrition, and revenue.
Rotation can improve several whole-sequence outputs together.
The baseline was continuous monoculture, and whole-sequence results used a much smaller subset. [6]
These results cannot be averaged into one expected rotation benefit. They describe different crops, baselines, climates, outcomes, and management systems.
The 2025 global synthesis also found gains in whole-sequence yield, nutrition, and gross revenue in the smaller set of experiments that reported both rotation phases. The comparison was with continuous monoculture, and the revenue analysis did not include a complete production-cost budget [6].
Swipe horizontally to inspect the full figure →
Click or tap to expand the figure
Model estimates and 95% confidence intervals from Costa et al. [2]. The spring-small-grain interval crosses zero. These are multi-site estimates at long-term-average growing conditions—not field predictions, fertilizer credits, or whole-rotation profit effects. — Figure: Soil Health Exchange; data from Costa et al. (2024) [2]
Keep the comparison with the percentage
“Rotation increased yield 20%” is incomplete. Which crop, following what crop, compared with what sequence, over how many years, under what nitrogen and water conditions? The denominator is part of the result.
A rotation works by changing legacies
Every crop leaves more than residue. It changes water extraction, nitrogen supply and demand, the timing and depth of roots, pathogen and insect hosts, the weed cohorts that set seed, soil cover, traffic, tillage, and the dates available for the next operation. Those changes are crop legacies. Rotation design is the arrangement of legacies so that one phase prepares the next without creating an unacceptable problem later in the cycle.
The legacy ledger: what each crop gives, takes, and shifts
Legacy
Questions before placing a crop
What to verify
Host legacy
Does it host the same pathogen, nematode, insect, or volunteer problem as the next crop?
Crop- and pathogen-specific host range; required non-host interval; volunteer and weed hosts
Nitrogen legacy
Does it fix N, scavenge N, immobilize N, or demand early available N?
Biomass, residue C:N, termination or harvest timing, local N-credit guidance
Water legacy
How much water remains, and at what depth, for the next phase?
Does this crop create or remove time for manure, drainage, lime, cover crops, or harvest?
Labor and machinery peaks, contractor availability, storage, drying, crop insurance and market dates
The best previous crop is not automatically the crop with the largest average yield effect. It is the crop whose complete legacy fits the next phase and the farm.
1. Break biological cycles—but identify the organism
A non-host interval can reduce reproduction of a host-specific pathogen, nematode, or insect. But “broadleaf” and “grass” are not universal break categories. Pathogens vary in host range and survival time; volunteers and weeds may bridge an apparent break; and some inoculum persists far longer than a one-year absence. In Minnesota sequence research, resistant soybean in annual rotation with corn produced the highest soybean yield among the tested soybean-cyst-nematode treatments, while susceptible soybean monoculture was lowest. That result combines crop sequence with genetic resistance—the two tactics reinforced each other. [14]
A short cover-crop interval is not automatically a disease break. A recent four-site-year winter-wheat study found that none of the tested single-year cover crops significantly reduced measured soilborne pathogen abundance compared with fallow, and some increased one Pythium group in one crop year. [13] Design the break around a named organism and verified hosts rather than a generic promise that diversity suppresses disease.
2. Rotate calendars to make weeds solve a new problem
A crop planted at the same time each year repeatedly favors weeds that emerge in that window and survive its control program. Alternating fall-, early-spring-, and late-spring-planted crops changes seedbed timing, canopy development, herbicide options, cultivation windows, and harvest disturbance. The global weed meta-analysis found a 49% reduction in weed density under diversified rotations, while planting-date variance explained suppression better than crop species richness. [7] That is direct evidence that calendar contrast can matter more than crop count.
This is not permission to assume a diverse rotation will manage weeds by itself. A crop that establishes slowly, has limited herbicide options, or is harvested after weed seed maturity can add to the seedbank. Score every phase for the weed cohorts it suppresses and the survivors it may allow to reproduce.
3. Treat legume effects as a measured legacy, not free nitrogen
The global 20% following-crop yield response to legume pre-crops is important, but it is not the same as an agronomic fertilizer credit. The meta-analysis compared following-crop yields after legume and non-legume pre-crops. It did not assign one transferable pounds-of-N value to every legume. Responses declined as fertilizer N increased and varied widely among continents and following crops. [5] Use current regional guidance, stand or biomass information, harvest removal, termination timing, and soil or plant tests where locally calibrated.
More N can also be mistimed. In semi-arid Australian sequence experiments, crop effects of 0.6–0.9 t/ha persisted three to four years through water, nitrogen, and disease legacies, but appeared in one experimental phase and not another. Residual legume N could even contribute to haying-off when it drove early growth that later exceeded water supply. [12] The useful question is not simply how much N a legume adds, but whether N release aligns with the next crop's water and uptake pattern.
4. Design root and water contrast for the climate
Deep and shallow roots, early and late water demand, and active versus fallow periods change where and when water is removed. In humid systems, longer living cover may increase infiltration and protect against excess water and erosion. In water-limited systems, a crop or cover can trade stored water for biomass and later benefits. The correct decision depends on soil profile, precipitation timing, crop rooting, termination, and the value of stored water to the following crop.
Long-term North American data support rotation as a resilience tool, not drought insurance. Bowles et al. found smaller maize losses during drought at many locations, but no average maize gain at the two most arid sites. [1] Costa et al. found that one additional functional group could offset modeled warming losses under some conditions, while combined warming and precipitation decline required more functional groups. [2] Rotation changes exposure and recovery; it does not eliminate the field water balance.
5. Build carbon through inputs and time—not labels
A rotation can change soil organic matter only if it changes carbon inputs, decomposition, erosion, or protection. King and Blesh found that cover-cropped and perennial-inclusive systems increased both estimated C inputs and SOC compared with grain-only systems. Within grain-only rotations, adding a grain legume reduced C input 16% and SOC 5.3% compared with cereal-only rotations; crop species richness alone had no SOC effect. [9] A crop can improve nitrogen supply and still produce too little residue to build carbon in that comparison.
The broader 122-study meta-analysis found modest changes in total soil C and N but much larger changes in microbial biomass C and N. [8] This is consistent with a system in which soil biology responds relatively quickly to altered roots and residue while total SOC changes more slowly and remains sensitive to sampling depth, equivalent soil mass, erosion, texture, and duration.
Perenniality is a design variable
A perennial forage, a well-established cover crop, or another phase that occupies an otherwise bare period can increase the duration of living roots and carbon input. But its value still depends on stand length, biomass, market or feed use, termination, water, and the crop that follows.
The Marsden Farm lesson: sequence creates management options
The nine-year Marsden Farm experiment in Iowa compared a two-year corn–soybean system with three- and four-year systems that added small grain, red clover, and alfalfa. During 2003–2011, mean corn yield rose from 12.3 Mg/ha in the two-year system to 12.7 and 12.9 Mg/ha in the longer systems; soybean rose from 3.4 to 3.8 Mg/ha. From 2006–2011, net returns to land and management did not differ statistically among systems, while profit variability was lower in the diversified rotations. [10]
Marsden Farm established-phase system comparison
Measure
2-year corn–soybean
3-year rotation
4-year rotation
How to read it
Corn yield, 2003–2011
12.3 Mg/ha
12.7 Mg/ha
12.9 Mg/ha
Corn in longer rotations yielded about 4% more on average
Soybean yield, 2003–2011
3.4 Mg/ha
3.8 Mg/ha
3.8 Mg/ha
Soybean in longer rotations yielded about 9% more
Manufactured N, rotation average
80 kg N/ha
16 kg N/ha
11 kg N/ha
Synthetic N only; longer rotations also received cattle manure and contained legumes
Herbicide active ingredient
1.9 kg/ha
0.26 kg/ha
0.20 kg/ha
About 88% lower in diversified systems, enabled by a different management package
Fossil energy use
8.6 GJ/ha
4.5 GJ/ha
4.2 GJ/ha
Rotation-average energy input
Labor
Baseline
>33% higher
>33% higher
Diversity redistributed costs and required more management time
Net return to land and management, 2006–2011
$953/ha
$965/ha
$913/ha
No statistical difference; P = 0.57
Davis et al. [10]. This was a whole-system experiment. It does not isolate the crop sequence from manure, reduced synthetic inputs, cultivation, and other coordinated management changes.
A longer sequence opened windows for forage legumes, manure, cultivation, and different herbicide use. Rotation design matters partly because it makes different management possible. The useful comparison is often one complete system versus another, with inputs, labor, risks, and outputs counted across the full cycle.
Why biologically promising rotations fail on farms
No reliable market or use: A break crop with no buyer, storage, feed value, or contract can weaken the whole farm despite an agronomic benefit.
The wrong sequence: The new crop may share a pest with its neighbor, leave excessive or insufficient residue, use needed water, or close the window for the next crop.
A crowded calendar: Planting, spraying, haying, and harvest may collide with the farm's highest-value crop or available labor.
Unpriced transition costs: Seed, headers, planters, drying, storage, learning, crop insurance, cash-flow timing, and quality discounts can dominate early years.
A single-crop budget: A break crop can look weak alone yet increase the following crop's yield or reduce its inputs; the reverse is also possible. Both phases belong in the budget.
Too many changes at once: Changing crop, tillage, fertility, and weed control together may build a better system, but it prevents attribution unless the experiment is intentionally a whole-system comparison.
Benefits expected too soon: Soil carbon, pathogen decline, seedbank change, and operational learning unfold on different time scales. The first cycle may not represent an established rotation.
The economic evidence is encouraging but local. In South Dakota's fifth four-year cycle, corn following pea yielded 45% more than corn in the two-year corn–soybean rotation, and soybean following winter wheat was 13–38% higher in one four-year sequence than several alternatives. Some legume-containing rotations also maintained stronger net revenue under modeled fertilizer-N price increases. [11] These are crop-and-sequence results from one long-term no-till experiment, not a price guarantee for another farm.
Across 20 North American long-term experiments, increased rotational complexity often improved maize and soybean gross crop returns, but whole-rotation output fell at eight sites when lower-output small grains or forages replaced higher-output crops. The study converted yields to gross crop value; it did not estimate profit after production costs. [3] Biological benefit, output, gross revenue, and net return are separate columns.
A practical rotation-design workflow
Step 1: Write the objective before naming a crop
Choose one primary objective and no more than two important secondary objectives. Examples include breaking a named pest cycle, creating a fall herbicide window, reducing purchased N exposure, protecting soil after harvest, spreading labor, improving drought resilience, producing forage, or increasing whole-cycle margin stability. A rotation designed to do everything usually has no explicit test of success.
Step 2: Map the current rotation as a sequence
Write each phase in order, including cover crops, fallow, double crops, forage establishment years, and termination. Then record planting, peak water and N demand, harvest, soil cover, tillage, herbicide sites of action, manure, grazing, and major traffic. The weak point often appears in a transition rather than in a crop.
Step 3: Find repeated selection pressure
Are two or more adjacent crops hosts for the same priority pest or pathogen?
Do most phases begin in the same planting window and select the same weed cohorts?
Does the sequence repeat the same herbicide sites of action or tillage depth?
Do high water-demand crops occur back-to-back in a water-limited profile?
Do high-residue crops repeatedly precede crops that require early warm seedbeds or readily available N?
Is there a long bare interval with erosion, nitrate-loss, or lost photosynthesis risk?
Does one labor or equipment bottleneck threaten timely establishment of several crops?
Step 4: Add a function, then choose the crop
If the problem is a summer-annual weed cohort, first seek a different establishment and harvest calendar; then identify crops that provide it. If the problem is low carbon input, seek more biomass or longer living cover; a low-residue grain legume may not solve it. If the problem is a host-specific disease, seek a verified non-host interval of adequate duration; do not start with a fashionable cover crop.
Step 5: Stress-test every transition
The transition test
Check
Question
Failure to avoid
Biology
Is the next crop a host for the same key pest, disease, or nematode?
A nominal break that continues the host bridge
Plant-back
Do all herbicide labels permit the intended crop and planting date?
Crop injury, illegal use, or forced delay
Nitrogen
Will N supply and immobilization match early and peak demand?
Double crediting legumes or underestimating high-C residue
Water
Will the previous phase leave adequate profile water under a dry scenario?
Trading next-crop establishment for unvalued biomass
Residue and seedbed
Can existing equipment place seed at uniform depth through the residue?
Poor stand, hairpinning, cold or wet seed zone
Calendar
Can harvest, termination, manure, and planting occur in the available days?
A biologically sound sequence that is chronically late
Market
Is there a buyer, quality specification, delivery window, storage plan, or internal feed value?
Budgeting at a price or basis the farm cannot capture
Risk
What happens under a wet spring, dry summer, early frost, or delayed harvest?
A rotation whose phases fail together under the same weather
Read herbicide labels and current crop-insurance, conservation-program, and nutrient-management requirements before implementation; these constraints change with product, location, and year.
Step 6: Budget the whole cycle per acre-year
For a rotation of Y years, annualize each complete-cycle total by dividing by Y. Keep yields, prices, variable costs, machinery, labor, drying, storage, insurance, program payments, and transition costs visible by phase. Credit a following-crop yield or input effect only when local evidence or a replicated field comparison supports it. Do not insert a global meta-analysis percentage as a farm budget line.
Minimum whole-cycle financial view
Line
Calculation
Why it matters
Annualized gross revenue
Sum of crop revenue across all phases ÷ cycle years
Prevents one high-value crop from hiding low-value years
Annualized variable cost
Seed + fertility + crop protection + fuel + drying + custom work across all phases ÷ years
Captures inputs shifted between crops
Annualized contribution margin
Gross revenue − variable cost, divided by cycle years
A comparable first economic screen; not a full-farm profit measure
Labor peak
Hours by week or month, not only annual hours
A rotation can have acceptable total labor and an impossible harvest collision
Downside case
Whole-cycle margin under low yield, poor quality, adverse basis, or high input price
Tests whether diversity changes correlated risk
Transition capital
Equipment, storage, learning, establishment, contract, and financing costs
Explains why established-trial returns may not describe adoption years
Use current local budgets and actual farm costs. Gross crop value in a research paper is not net return, cash flow, or return to management.
Step 7: Rank candidates by fit, not by one score
Rotation candidate scorecard
Design dimension
Poor fit
Adequate fit
Strong fit
Priority constraint
Does not address the named problem
Indirect or uncertain effect
Creates a direct, testable break or opportunity
Functional contrast
Repeats most host, timing, root, and input traits
Changes one important trait
Changes several traits relevant to the objective
Sequence compatibility
One or more unacceptable transitions
Risks can be managed at added cost
Each phase prepares a feasible next phase
Water and climate
Fails under a common weather scenario
Acceptable in average conditions
Spreads exposure or preserves recovery options
Market and policy
No dependable use or program fit
Niche or conditional outlet
Established buyer, feed use, contract, or durable value
Operations
Requires unavailable equipment or collides with peak work
Possible with custom work or schedule change
Fits machinery, labor, storage, and timing
Whole-cycle economics
Negative in realistic base and downside cases
Competitive only with uncertain credits
Competitive before unverified soil-health credits
Learning and reversibility
Large irreversible commitment
Pilot is possible but costly
Can be tested at useful scale with a clear exit
The categories are a deliberation aid, not a validated universal index. Keep the underlying evidence and assumptions visible.
Potentially strong starting directions
Start with the field's most expensive or persistent constraint, then choose a crop or phase that creates the missing contrast. The directions below are practical candidates to investigate—not universal recipes. Use the checks in the last column to decide whether a candidate deserves a small, measured trial on your farm.
Match the rotation direction to the problem
Field priority
Promising direction
Why it may help
Check before trying
Resistant summer annual weeds in corn–soybean
Add a marketable winter or spring small-grain phase and use its earlier harvest window for targeted control, a cover crop, or both
Changes planting date, canopy timing, harvest timing, herbicide options, and the window for preventing seed return
Confirm a buyer and quality requirements; review herbicide carryover and labels, volunteer grain, equipment, and cover-crop termination
Frequent cereal disease or grass-weed pressure
Insert a verified non-host pulse or other broadleaf break crop at an interval matched to the named pest
Interrupts host continuity and creates different crop-protection, planting, and harvest opportunities
Identify the pathogen or weed first; check alternate hosts, required break length, broadleaf-disease overlap, water use, and market
Low residue and a long bare period
Pair a small grain with a dependable forage, cover-crop, or perennial phase where that phase has a real use
Extends living roots and soil cover, adds residue, and changes traffic and nutrient-cycling patterns
Define feed, grazing, conservation, or other value; plan establishment, termination, water use, nutrient removal, and the return to a cash crop
Semi-arid cereal system needing a biological and management break
Trial a locally adapted pulse or oilseed break at a frequency supported by stored-water and disease evidence
Creates non-cereal host status, a different residue and nitrogen legacy, and potentially different weed-control options
Unstable annual-crop margins where livestock or forage markets are available
Test a multi-year forage phase before returning to annual crops
Adds perenniality, feed value, different rooting and traffic patterns, and another timing and income pathway
Budget fencing, establishment, stand duration, harvest or grazing logistics, termination, and the transition back to annual crops
These are starting directions, not prescriptions. A longer rotation earns its place by changing a limiting process and surviving the agronomic, operational, and financial transition test—not by increasing crop count.
Test the change before expanding it
Pilot the candidate on representative acreage, name the result that would justify expansion, and set an exit rule before planting. Compare the complete rotation cycle—including the break crop, transition costs, labor, and downside years—not only the yield of the crop that follows.
How to test a rotation without waiting a decade for an answer
A complete rotation still takes a full cycle to observe, and many soil outcomes take longer. But a good trial can produce useful decisions sooner. The key is to represent the system correctly. If each rotation phase occurs in a different year with no same-year comparison, weather becomes inseparable from phase. Research networks avoid this by growing every phase of each rotation every year where land and design permit.
State the comparison. Name the current sequence and the candidate sequence; decide whether this is a crop-sequence test or an intentional whole-system test.
Represent all phases. Where feasible, establish each entry point so every crop appears under the same year's weather.
Replicate and randomize. Use multiple blocks across known field variation; one strip per treatment is a demonstration, not a reliable estimate.
Keep treatment boundaries intact. Do not average headlands, wet spots, or soil changes into the comparison without blocking or separate analysis.
Measure the mechanism. If weed suppression is the goal, count density, biomass, and seed return—not yield alone. If N is the goal, record fertilizer, legume biomass, soil or plant N, and grain removal.
Record operations and failures. Planting delay, passes, labor, drying, storage, herbicide restrictions, quality discounts, and rejected loads belong in the result.
Continue through at least one full cycle. Label first-cycle and established-rotation observations separately.
Analyze per crop and per cycle. A higher following-crop yield does not prove higher whole-rotation output or profit.
A compact rotation measurement set
Outcome
Minimum measure
Useful companion
Production
Marketable yield and quality for every phase
Biomass, harvest index, rejected or unharvested product
Economics
Price received and variable cost by phase
Labor timing, machinery, storage, insurance, transition capital
Nitrogen
All N sources and removal
Soil nitrate, plant N, legume or cover biomass and termination date
Water
Rainfall and irrigation
Profile water at planting and harvest, infiltration, rooting depth
Weeds
Density before control and seed return
Biomass, species, survivor map, sites of action and cultivation
Pests and disease
Named organism, incidence and severity
Host interval, inoculum or nematode count where interpretable
Soil
SOC using consistent depth and equivalent-mass logic
Aggregate stability, infiltration, microbial or labile-C indicators with timing documented
Resilience
Yield and margin across years
Downside deviation, probability of loss, recovery after stress
Measurement should follow the design objective. A large soil-health panel cannot rescue an experiment that omitted yield, inputs, weather, and operations.
How to read rotation evidence without overpromising
Monoculture is a low bar. A large rotation-versus-monoculture response may shrink when the real alternative is a well-managed two-crop rotation.
Following-crop yield is not whole-cycle performance. Report the break crop, subsequent crop, and annualized sequence separately.
Gross return is not profit. Crop value excludes some or all production, labor, machinery, transition, and risk costs.
Synthetic N is not total N. Manure, fixation, residual nitrate, irrigation water, and soil supply must remain visible.
Weed density is not weed biomass or seed return. A few large survivors can matter more than many suppressed seedlings.
Functional richness is not a recipe. The same nominal functional group can behave differently across climates and sequences.
Long-term-trial averages are population evidence. They support a direction and mechanism; they do not predict one field-year.
System experiments answer system questions. If rotation changes manure, tillage, and crop protection together, attribute the result to the package unless the design separates effects.
The standard for a useful rotation claim
Name the sequence, baseline, outcome, time period, management package, climate and uncertainty. Then say whether the result describes one crop, the full cycle, or the farm business.
What the evidence does—and does not—support
The evidence supports a strong conclusion: purposeful crop rotation can improve following-crop yield, reduce weed density, alter soil C and N pools, and make production more resilient under some stressful conditions. It also supports a less comfortable conclusion: crop count alone does not guarantee those outcomes. Functional contrast, order, duration, inputs, and local fit determine whether potential becomes performance.
The 16-year South Dakota experiment illustrates the opportunity. Corn–oat–winter wheat–soybean produced no less grain than corn–soybean on average while approaching the stability of the most stable rotations. The authors traced that result to crop selection, sequencing, beneficial legacies, and crops occupying different weather niches—not to diversity as an abstract number. [4]
A one-page rotation brief
One-page rotation design brief
Field
What to write
Field and constraints
Location, soil and drainage, water regime, slope, equipment, labor, storage, buyer, insurance and program constraints
Current sequence
Every cash crop, cover, fallow, forage year, double crop, termination, manure and major tillage event in order
Primary objective
One measurable problem and the threshold for success
Repeated pressure
Shared hosts, planting windows, water demand, residue, herbicide sites of action, traffic or fallow periods
Candidate functional move
The contrast needed before selecting a species
Candidate sequence
Exact order, duration and entry points—not a crop list
Transition risks
Host range, plant-back, N, water, residue, calendar, market and downside weather
Whole-cycle budget
Base and downside annualized margin, labor peaks, capital and unverified credits kept separate
Trial and measurements
Replicates, all phases, treatment boundaries, yield, inputs, operations, mechanism and review date
Decision rule
What evidence will trigger expansion, redesign or exit after the first and established cycles
A rotation becomes a decision when its sequence, assumptions, risks, measurements, and exit rule are written down.
The RotationIQ screening tool can help compare evidence-backed starting points, but it cannot see a field's buyer, tile, resistant weed patch, equipment bottleneck, label restrictions, or cash flow. Use any ranking as a hypothesis generator. The final sequence must survive the legacy ledger, transition test, whole-cycle budget, and local agronomic review.
Before you finalize the rotation
A rotation is successful when each phase changes the conditions faced by the next phase in a useful way—and the entire cycle remains executable and economically defensible. Sometimes that means adding a crop. Sometimes it means changing order, extending a forage phase, using a different planting window, inserting a cover crop, or removing a redundant phase.
Start with the field's limiting process, choose a phase that creates the needed contrast, test every transition, and measure the whole cycle. Then count the crops. The number matters only when the sequence remains workable and improves the result you set out to change.
Soil Health Exchange Team (2026). Crop Rotation Is a System, Not a List. Soil Health Exchange. https://soilhealthexchange.com/blog/crop-rotation-design-matters
More citation formats
MLA
Soil Health Exchange Team. "Crop Rotation Is a System, Not a List." Soil Health Exchange, 2026-08-31, https://soilhealthexchange.com/blog/crop-rotation-design-matters.
Chicago
Soil Health Exchange Team. "Crop Rotation Is a System, Not a List." Soil Health Exchange. Published 2026-08-31. https://soilhealthexchange.com/blog/crop-rotation-design-matters.
Discussion
No comments yet. Be the first to share your thoughts!