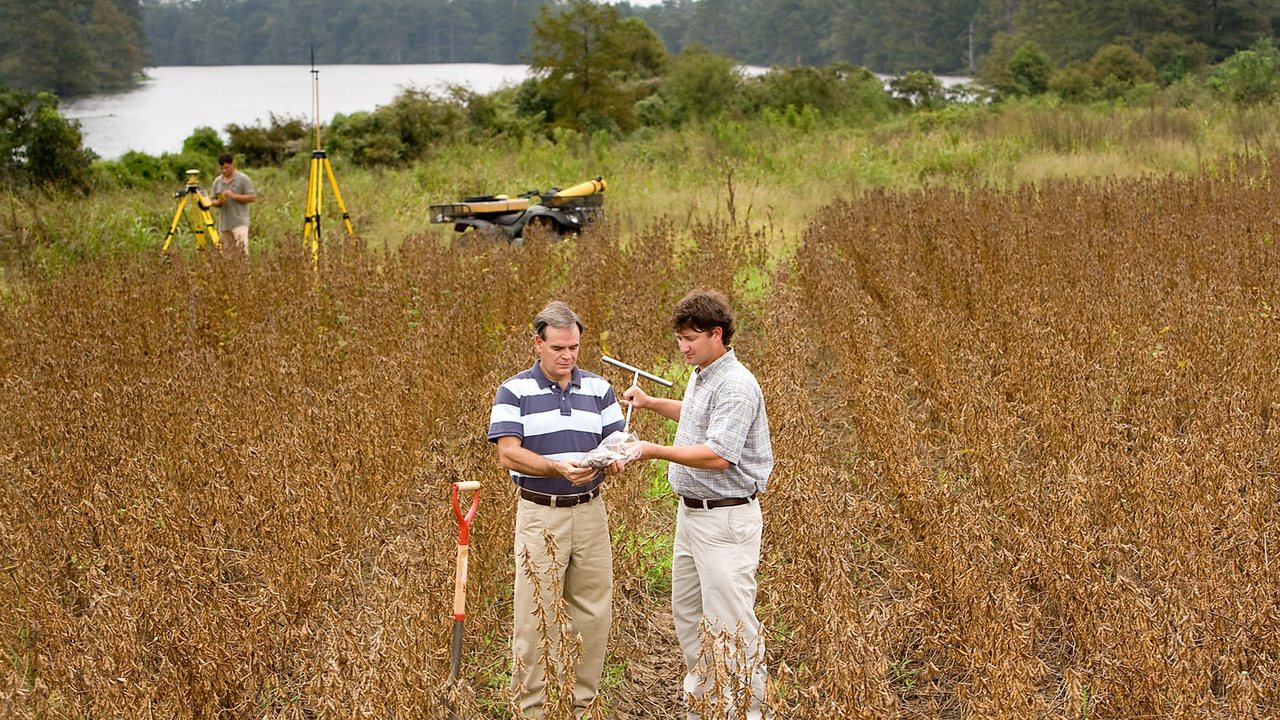
Once the crop is off, it is often easier to get across the field—and there is still time to collect a sample, get it to the laboratory, and make a plan before the next lime, fertilizer, manure, or other amendment goes on. Iowa State and Utah State both describe post-harvest fall sampling as a useful window when the timing and protocol fit the decision. [1][3]
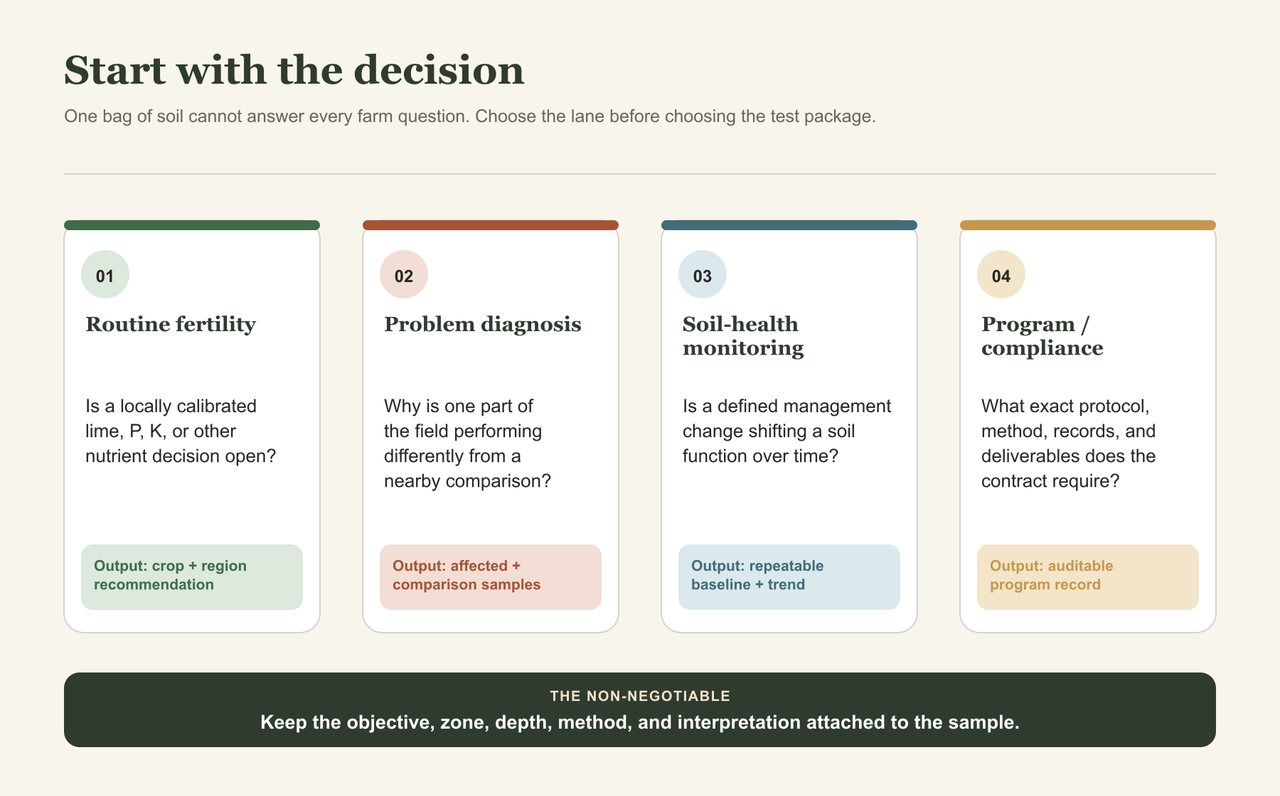
Start with one practical question: “What farm decision should this sample change?” A routine fertility check, an investigation of a weak area, a soil-health baseline, and an NRCS program sample are different jobs. They may need different maps, depths, core patterns, handling, tests, and interpretations. This guide walks through the choices in order: name the decision, choose the matching protocol, map the area, collect consistently, and interpret the report with the right calibration.
1. Choose the job before choosing the test
Routine fertility: a calibrated input decision
If the question is lime, phosphorus, potassium, or another nutrient, use a routine fertility test calibrated for the crop and region. The laboratory number becomes useful only when it is read through the recommendation system built for that extractant, sampling depth, soil context, and crop. Iowa, Pennsylvania, and Missouri each tie interpretation to their own methods and field-based recommendation systems. [1][9][16]
Problem diagnosis: preserve the contrast
When one area is yellow, stunted, ponded, droughty, saline-looking, or consistently lower yielding, do not blend it into the rest of the field. Sample the affected area and a nearby, comparable area separately, using the same depth, core pattern, timing, tools, and laboratory methods. Add notes on roots, compaction, infiltration, drainage, pests, herbicides, and management. Together, the samples and field observations can show whether chemistry is part of the explanation and where to look next.
Soil-health monitoring: build a repeatable comparison
A soil-health panel becomes more useful when it follows a clear management question—for example, whether reduced tillage, a cover crop, manure, grazing, or a more diverse rotation is changing a particular soil function. Keep the season, zone, depth, method, and handling consistent over time. Use biological indicators for the comparisons they support, and use locally calibrated fertility tests for fertilizer-rate decisions. [10][13][17]
Program sampling: follow the contract
If the sample is for a conservation, carbon, certification, research, or regulatory program, let the current program documents lead. They may specify the design, approved methods, laboratory qualifications, chain of custody, reporting, and repeat visit. CEMA 216 is one example: its 2026 standard and job aid require a documented soil-health-testing workflow that is more specific than routine fertility sampling. [15]
Match the sample to the decision
| Sampling job | Question | Design priority | Interpretation output |
|---|---|---|---|
| Routine fertility | Is a locally calibrated input response likely? | Representative management area and correct calibration depth | Crop- and region-specific category or recommendation |
| Problem diagnosis | Why is one zone behaving differently? | Affected and matched comparison samples kept separate | A supported hypothesis plus the next diagnostic check |
| Soil-health monitoring | Is a management change shifting a soil function? | Repeatable zones, timing, depth, method, and handling | Comparable baseline, trend, or peer-group context |
| Program or compliance | What evidence does the contract require? | Exact current program protocol and records | Auditable deliverable for the specified program |
2. Plan before harvest; collect on the right clock
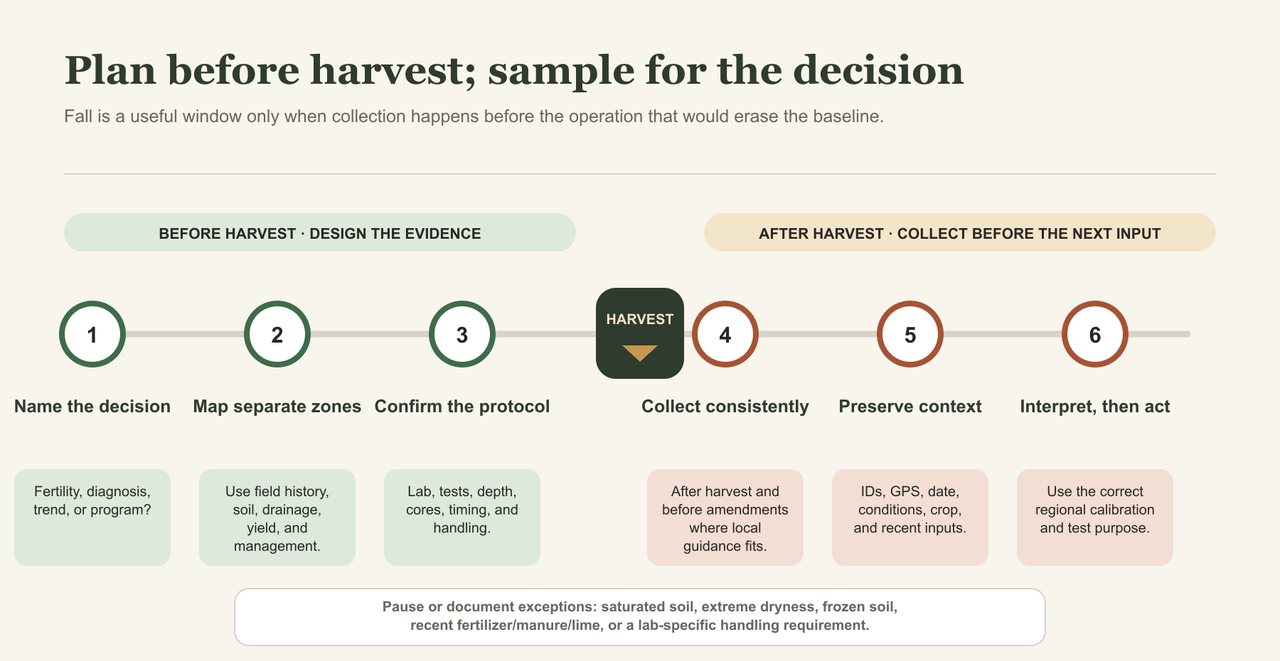
Make the plan before harvest, while there is still time to call the laboratory, divide the field, confirm the tests and depth, and gather the right bags and supplies. Collection often comes after harvest and before fertilizer or amendments. If this is a repeat sample, stay in the same season so a normal seasonal shift is less likely to be mistaken for a management response. [1][3]
When to pause
The calendar may say it is time to sample, but the field gets the final word. Wait if saturated soil makes travel unsafe or prevents consistent cores, and check local guidance before sampling frozen ground. Record any recent fertilizer, manure, lime, or banded nutrients that could affect the result. For biological analyses, arrange bags, cooling, and shipping with the receiving laboratory before collection. [3][5][14]
A very dry fall can also complicate the sample. Dry soil is harder to core to a consistent depth, and Iowa State reports that prolonged dryness can produce lower-than-expected potassium and pH values, with phosphorus sometimes affected. Where Iowa guidance applies, it suggests waiting until roughly a week after rain has wetted the sampling depth when practical. Elsewhere, record the dry conditions and follow local guidance. [1][2]
Timing questions to settle before collection
| Situation | Ask before sampling | Why it matters |
|---|---|---|
| Routine fertility | Has fertilizer, manure, lime, or another amendment already been applied? | Recent inputs can make the sample unrepresentative of the intended baseline |
| Repeated trend | Can I repeat the same season, zone, depth, laboratory, and method? | Method and seasonal drift can look like management change |
| Dry fall | Can I obtain full, consistent cores, and does local guidance advise waiting for rain? | Lost surface soil and dry-soil chemistry can bias interpretation |
| Nitrate or sulfate | What depth, date, crop, soil, and field history does the local calibration require? | Mobile nutrients can change quickly and may require a profile sample |
| Biological test | Must the soil be fresh, cooled, refrigerated, dried, or shipped within a holding time? | Handling can change biological measurements before the lab receives them |
| Program sample | Does the contract require approval or a pre-work conference before fieldwork? | An otherwise careful sample can still fail the program record |
3. Draw the sampling map before drawing the first core
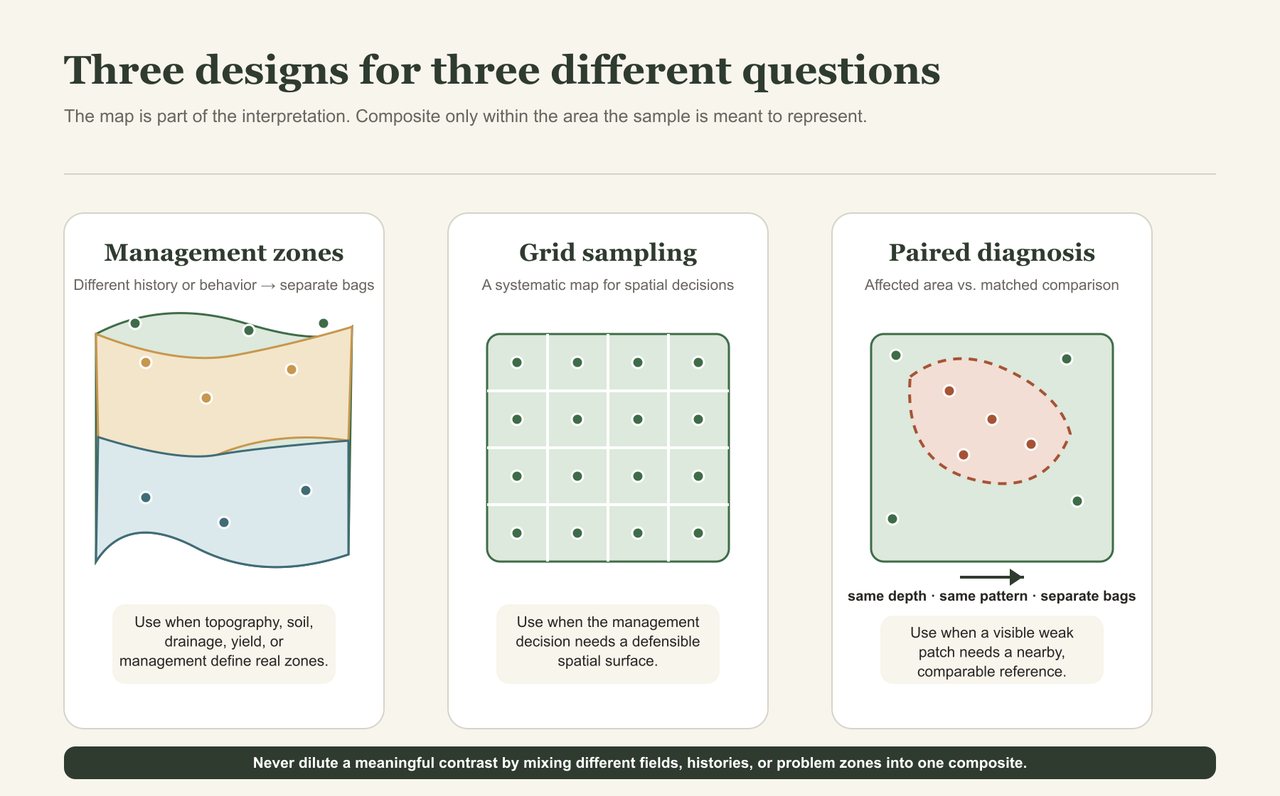
Soil changes across a field with texture, slope, erosion and deposition, drainage, old boundaries, manure and fertilizer history, tillage, traffic, and yield removal. A composite is only useful when its cores represent the same management area. Iowa State, Penn State, and Oklahoma State all recommend separating unlike areas instead of averaging them into one sample. [1][4][6]
Management zones
Management zones work well when field history and observed behavior point to areas that may need different decisions. Build them from soil survey information, topography, yield maps, aerial imagery, manure and fertilizer records, crop history, drainage, and what you have seen in the field. Each zone should have a practical reason for being separate.
Grid sampling
A grid can help when you need a systematic map, such as deciding whether site-specific lime or nutrient application is worthwhile. Match the grid size, point or cell method, core pattern, and resampling plan to local guidance and the economics of the decision. More points are only useful if the grid answers the question you actually have.
Paired diagnostic sampling
For a visible problem, keep the affected patch and the matched comparison separate. Match soil type, slope position, crop, management, and moisture as closely as possible. Use the same depth, number of cores, pattern, tools, date, handling, and laboratory methods. The result shows whether chemistry differs; it does not prove that chemistry caused the crop response.
SHE’s Field Sampling Planner can draw or import the field boundary, create composite, grid, or management-zone points, record depth and cores per sample, track GPS collection, and export a plan. Confirm the correct local or program protocol and calibration before building the design.
4. Build a representative composite
The laboratory can only analyze the soil you send. Much of the uncertainty begins before the bag reaches the instrument. Build each composite from multiple full-depth cores collected across one defined sampling area, rather than clustering around the gate, truck, or easiest patch.
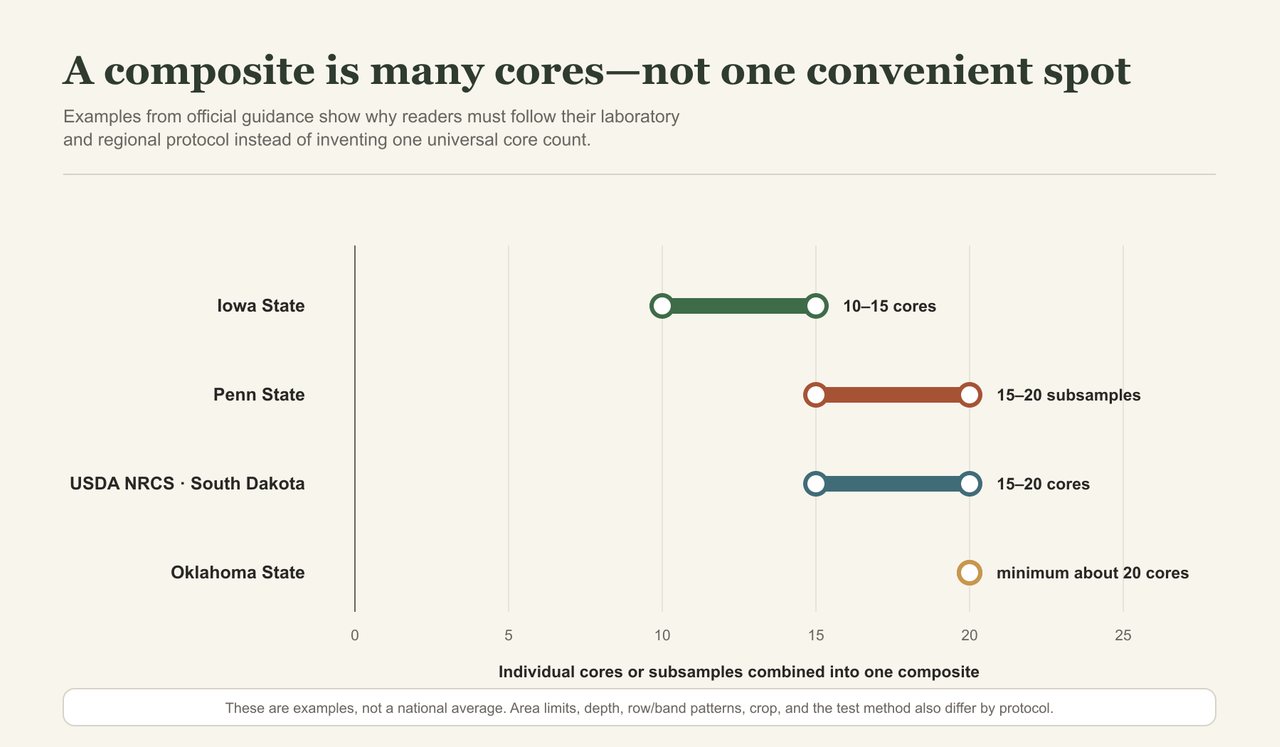
Core-count examples differ because the crop, region, area represented, spatial variability, row or fertilizer-band pattern, depth, and analyte differ. Iowa State advises that a composite generally represent no more than about 10 acres unless evidence supports a larger uniform area; Penn State’s example pairs 15–20 subsamples with an area of 10 acres or less. Follow the example specified by the applicable local protocol. [1][4]
Control depth—every core, every time
Sampling depth is part of the recommendation system. Iowa State’s P, K, zinc, organic matter, pH, and buffer-pH interpretations use a six-inch sampling depth. Penn State’s cultivated-field guidance uses six to seven inches, while its pasture guidance differs. Other states, crops, tillage systems, laboratories, and mobile-nutrient tests specify other depths. [1][4][7]
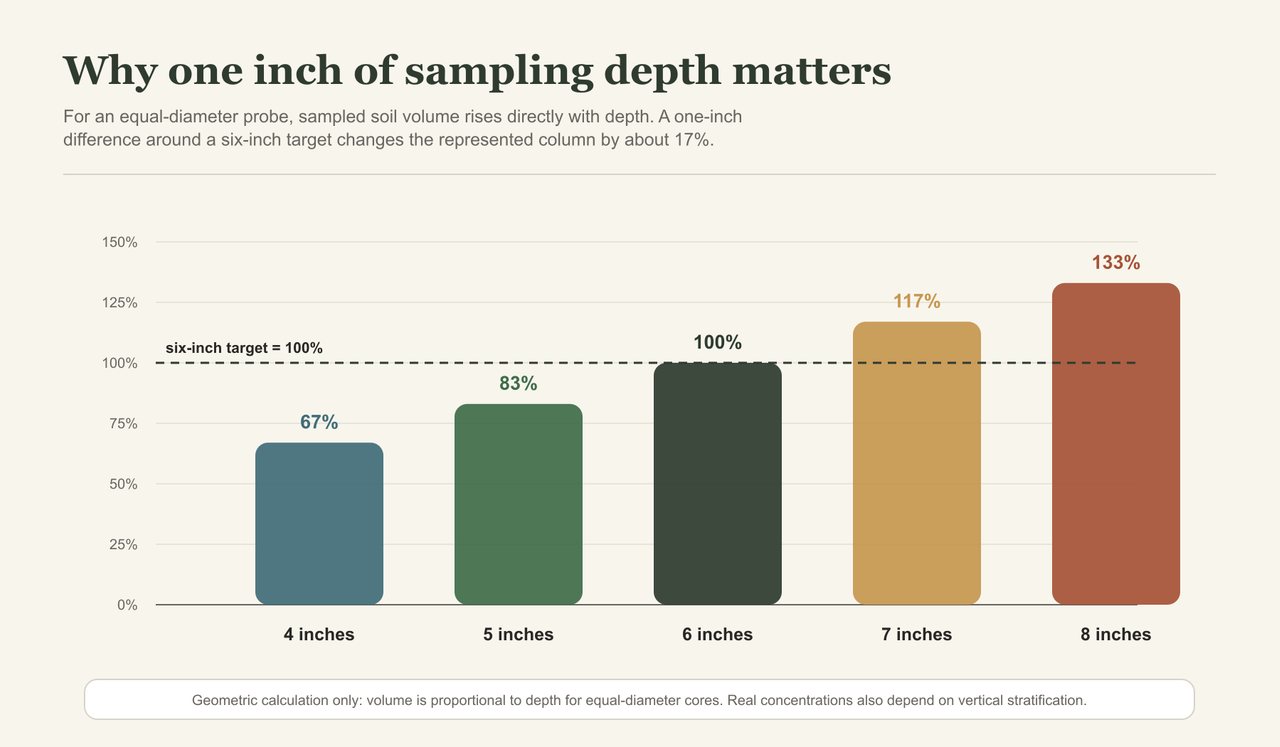
A one-inch miss around a six-inch target changes the length—and therefore the volume—of an equal-diameter core by about 17%. In no-till or other stratified systems, the concentration effect can be larger or smaller because surface-applied lime and nutrients are not uniformly distributed with depth. Aim for a vertical, complete core every time: retain the surface portion and stop cleanly at the target depth. [2][4][7]
Account for rows, bands, and atypical spots
Recent fertilizer bands, manure, old feedlots, lime piles, headlands, fence lines, waterways, dead furrows, and areas where livestock congregate can dominate a composite. Bypass them when they fall outside the sampling objective, or give them a separate sample when they are the question. In row crops, distribute cores across the row positions directed by local guidance so one repeated distance from a band does not define the result. [1][4][6]
Use clean tools and preserve the sample
- Use a clean probe or an equal-depth slice from a spade; avoid a wedge that overrepresents the surface.
- Mix cores from one sampling area thoroughly in a clean bucket made from material compatible with the requested analyses.
- Keep different zones, depths, and diagnostic pairs in separate, clearly labeled bags.
- Record any moved or skipped point, unusual core, residue, moisture, access issue, or contamination risk.
- Follow the receiving laboratory’s instructions for air drying, cooling, refrigeration, bag type, holding time, and shipping.
5. Order tests connected to an action
Before adding a test to the order, ask what you would do differently if the result were high, low, or unchanged. Routine fertility, nitrogen, salinity, disease, and soil-health monitoring need different evidence. An exploratory baseline can still be useful, but only if you know how you will compare or use it later.
What common test groups support
| Test group | Order it when | Strongest use | Unsupported assumption |
|---|---|---|---|
| pH plus local lime-requirement method | A crop pH or liming decision is open | Estimate active acidity and, with the correct buffer or local method, reserve acidity and lime need | Soil pH alone is a lime rate or all buffer systems are interchangeable |
| Calibrated P and K | The crop, extractant, depth, and regional recommendation system are known | Estimate response probability and build, maintain, or withhold decisions | The same ppm value has the same category in every method or state |
| Organic matter or total carbon | You need context or a consistently measured long-term trend | Support interpretation of soil behavior and monitor direction over time | A small one-year change proves management success or failure |
| Nitrate-N or sulfate-S | A local protocol specifies crop, timing, depth, field history, and interpretation | Support a defined residual or in-season nutrient decision | A routine surface fall value supplies a universal next-season credit |
| Electrical conductivity, salinity, or sodicity tests |
Routine fertility: the useful core
For many row-crop fields, routine sampling begins with pH and lime requirement plus locally calibrated phosphorus and potassium. Organic matter adds useful context in many recommendation systems. Add other nutrients when the crop, soil, region, management history, or symptoms give you a reason to investigate them. Iowa, Pennsylvania, and Missouri each use their own methods and recommendation logic. [1][9][16]
pH and lime: two different questions
Soil pH tells you about active acidity; it does not tell you the lime rate by itself. A locally calibrated buffer or other approved lime-requirement method estimates the reserve acidity that must be neutralized for the crop target. Then account for lime quality and the expected incorporation before converting the recommendation into a product rate. [8][9]
Phosphorus and potassium: method names matter
Bray, Olsen, Mehlich-3, Modified Morgan, ammonium acetate, and other methods extract different pools or are calibrated under different conditions. The report should retain the method, units, depth, crop, and local category. If those are missing, ask the laboratory before comparing the number with an Extension table or an older report. [9][11][16]
Nitrogen: give the question the right timing and depth
Nitrate moves with water and changes with mineralization, immobilization, crop uptake, leaching, and denitrification. Western Minnesota has defined circumstances for deep residual nitrate sampling; Pennsylvania uses an in-season pre-sidedress test for certain corn systems; other regions use different or no fall nitrate credit. Use an N test only where its timing, depth, field-history criteria, and recommendation equation are locally calibrated. [3][5][12]
Soil-health tests: define the comparison first
Aggregate stability, soil organic carbon, respiration, active or labile carbon, ACE protein, PMN, PLFA, enzymes, and related measurements each describe a different part of the system. They also differ in method, units, handling, repeatability, and interpretation. Choose the smallest set that answers the comparison or meets the program requirement, then read each result within its own method. Use a result for fertilizer rates only when a suitable crop and regional calibration exists. [10][13][17]
Before adding a biological analysis, read SHE’s method-specific explainers: PLFA, ACE protein, PMN, the four-day CO₂ burst, and POX-C. Each explains what the result measures, what changes it, and where interpretation stops.
6. Call the laboratory before you collect
Treat the laboratory as part of the sampling team. A five-minute call or written confirmation can settle the depth, bag, drying method, holding time, extractant, and package before anyone enters the field. It is much easier to change the order then than to discover after collection that the wrong container, depth, or handling was used. USDA NRCS guidance also emphasizes method fit, quality systems, reporting, and consistent repeat measurements. [14]
- Which exact analytical method will be used for each result?
- What sample depth and number of cores does the interpretation assume?
- Which crop, region, and recommendation calibration will appear on the report?
- How much soil is needed, and what bag or container should be used?
- Should the sample be air-dried, kept cool, refrigerated, frozen, or shipped fresh?
- What is the maximum holding time before analysis?
- Can the laboratory keep the same method for future trend samples?
- How are qualifiers, detection limits, units, and calculated values reported?
- Does the laboratory participate in an appropriate proficiency or quality-assurance program?
- For a contract or CEMA 216 sample, does the laboratory and method meet the current program requirements?
7. A field protocol you can hand to the sampler
- Write one sentence naming the decision the sample must support.
- Select the correct local, laboratory, or program protocol and record its date or version.
- Draw the field and separate unlike management areas before collection.
- Assign stable field, zone, sample, and depth IDs that will still make sense when the report returns.
- Confirm the laboratory, methods, package, sample amount, container, handling, and shipping.
- Set the exact depth, core count, pattern, row or band positions, and exclusion rules for each sample.
- Collect full, vertical, equal-depth cores with clean tools; keep zones and depths separate.
- Mix each composite thoroughly, transfer the required amount, and label it immediately.
- Record GPS or mapped area, date, field condition, crop, next crop, recent fertilizer, manure, lime, amendments, and tillage.
- Preserve and ship the sample exactly as the laboratory requires, then attach the report to the field record.
For a mapped route and collection record, open the free Field Sampling Planner. Producers sampling under CEMA 216 should also use the program-specific sampling-plan guide and current NRCS documents.
8. How to use the results without overreaching
When the report arrives, resist the urge to jump straight to a product rate. Read it in five passes: verify the sample, find the matching calibration, separate fertility from soil-health interpretation, check whether the comparison is valid, and only then choose an action.
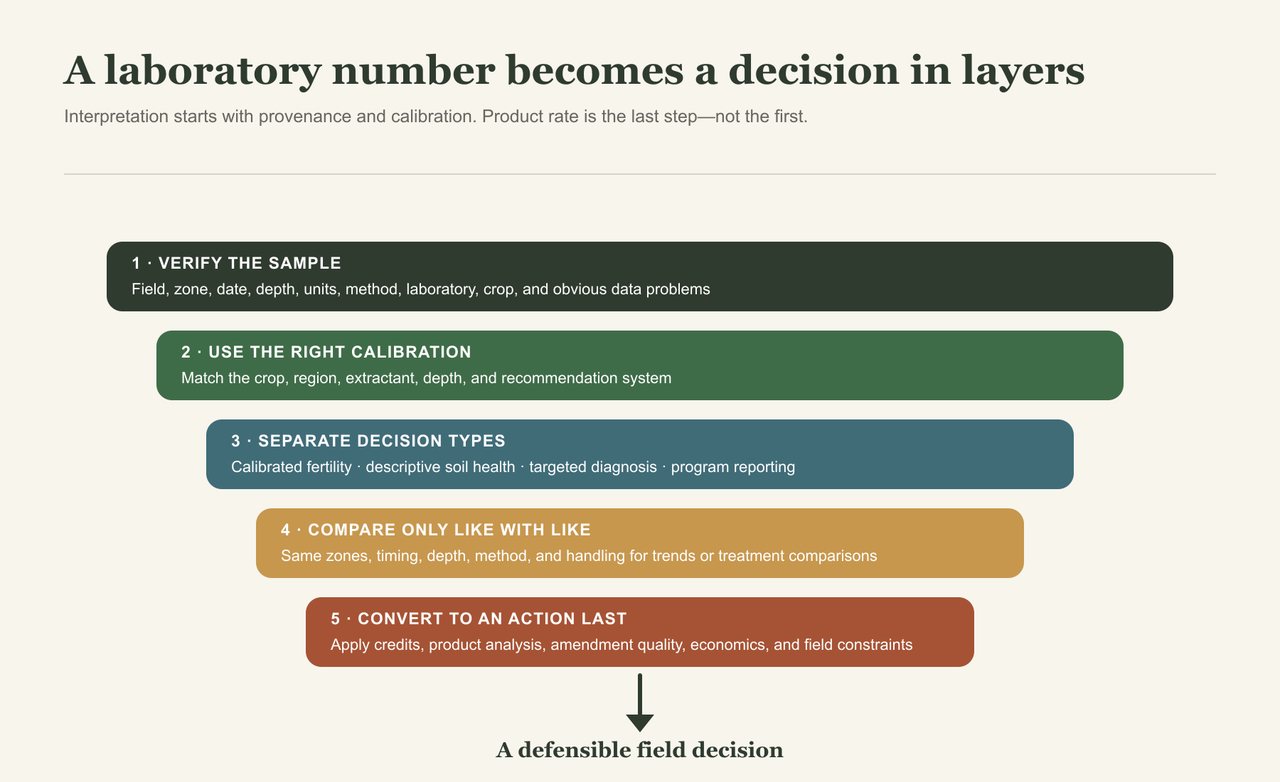
Layer 1: verify identity and provenance
Confirm the field and zone, sample date, depth, crop, laboratory, methods, units, and whether the report mixed or omitted any samples. Look for impossible units, missing qualifiers, values reported only as pounds per acre without the assumed depth, or recommendations for the wrong crop. Correct any field, zone, or crop mismatch before interpreting the result.
Layer 2: find the calibrated interpretation
For fertility decisions, use the laboratory or Extension category that matches the analytical method, crop, region, and sampling depth. Very low, low, optimum, high, and similar labels estimate response probability within a recommendation system; the same raw number can mean something different under another extractant or crop calibration. [9][11][16]
Layer 3: separate fertility from soil-health interpretation
A calibrated P category can support a fertilizer decision. Respiration or PLFA may describe biological activity or community biomass under a specified method. Organic matter can provide context and a trend. CEC can help explain buffering and retention. Interpret each feature within its own method and decision pathway instead of combining them into one amendment recommendation.
Layer 4: compare only comparable results
Before calling a number a trend, confirm that the zone, season, depth, core pattern, laboratory, method, and handling are comparable. Review individual composites, not only their average. A management response should also appear in relevant field outcomes: yield stability, infiltration, erosion, rooting, trafficability, input response, or another measure connected to the original objective.
Layer 5: convert the recommendation into an action
Only after the recommendation is valid should it become a product rate. Account for the planned crop and yield basis, legume or manure credits, previously applied nutrients, product nutrient analysis, lime CCE or locally used quality expression, placement, incorporation, timing, cash flow, and environmental or operational constraints. Current Missouri, Minnesota, and Pennsylvania guides make these dependencies explicit. [8][9][16]
Stop signs in a soil report
| Red flag | Why to stop | Next check |
|---|---|---|
| Depth missing | Concentration and recommendation may not match the calibration | Confirm the actual collection depth and the laboratory assumption |
| Method missing | A value cannot be matched safely to an extractant-specific category | Ask the laboratory for the analytical method |
| Wrong crop or region | The recommendation may use a different response curve or target | Request the correct crop and regional interpretation |
| One composite covers unlike zones | The average can conceal both deficiency and excess | Resample meaningful zones separately |
| Large change after method or lab switch | Analytical change can look like management change | Run an overlap comparison before joining the trend |
| Fall nitrate treated as a universal N credit | Timing, depth, weather, and local calibration may not support it | Use the locally validated nitrate decision pathway |
| Biological score converted directly to product pounds |
9. What this looks like in the field
A dry fall produces a surprisingly low potassium result
Start by verifying the surprising value before rebuilding the fertilizer plan. Check whether full-depth cores retained the dry, nutrient-enriched surface; review rainfall, sampling date, depth, row position, laboratory method, prior trend, yield removal, and local dry-fall guidance. Iowa State specifically warns that dry conditions can depress apparent K and pH. [2]
One low-yielding patch persists across years
Keep the patch visible in the sampling design. Collect affected and matched comparison samples, then inspect rooting depth, compaction, drainage, traffic, landscape position, stand history, and herbicide or disease evidence. A chemistry difference can narrow the hypothesis; no difference is also useful because it redirects the diagnosis.
A biological package promises a complete soil-health score
Write the management comparison first. Ask which methods are used, how samples must be handled, whether peer groups match the soil and climate, what change exceeds method and field variability, and which farm decision would follow. If those answers are missing, use the result only as exploratory baseline information. [10][13][14][17]
10. Make this fall’s sample useful three years from now
The most valuable sample may be the one you can repeat with confidence. Save the field boundary and zones, collection route or GPS area, stable sample IDs, date, conditions, depth, core count, pattern, crop, recent inputs, laboratory, methods, units, report, interpretation, and action taken. When you sample again, that record helps separate a real management change from a different method, season, or location.
If the report is already in hand, SHE’s soil-report interpretation tool preserves method, units, sample depth, and field context and separates measured results from provisional or supported recommendations. If the field still needs a design, start with the Field Sampling Planner.