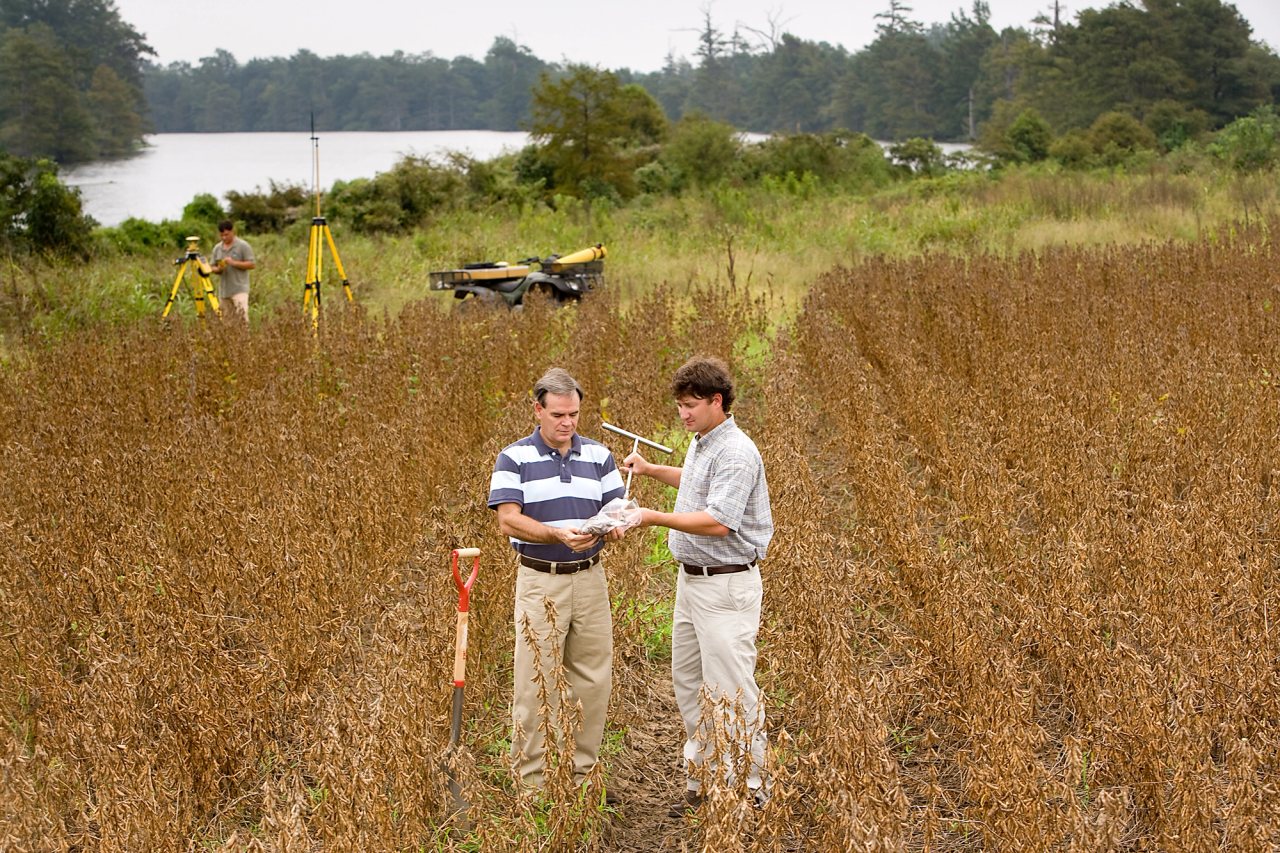
You have kept the ground covered, changed the rotation, or reduced tillage. The soil seems easier to work. Then the laboratory report arrives: organic matter barely moved, one biological indicator rose, and the overall score fell. Is the field improving?
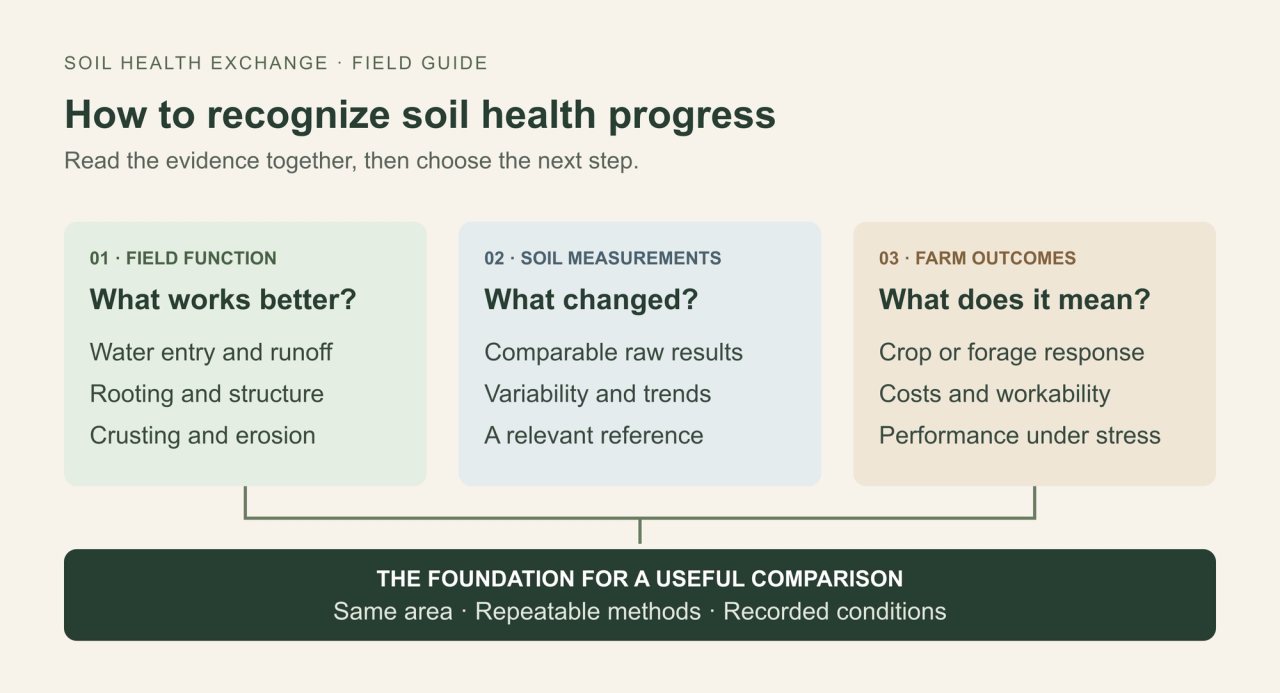
The strongest answer comes from a pattern: the soil performs better, comparable measurements support that change, and the improvement persists across conditions that matter on your farm. Start with the problem you wanted to solve, keep the comparison consistent, and read the laboratory results alongside what happens in the field.
Soil health describes a soil’s ability to keep supporting life and performing functions such as regulating water, cycling nutrients, and sustaining plant growth. Physical structure, chemistry, and biology work together. A field can improve in one function while another still needs attention [1].
Start with the problem you want the soil to solve
Write one sentence before choosing a test: “I want this field to absorb intense rain with less runoff,” or “I want roots to explore below the compacted layer.” That sentence determines what you measure. If the concern is surface sealing, pair observations of crusting and water entry with aggregate stability. If it is acidity, use a pH test and the region’s lime-requirement procedure. If it is nutrient supply, use the appropriate fertility tests [8].
Keep a record of the practice too: cover-crop establishment, grazing, residue removal, traffic, or tillage. Those records describe what you did. Measurements and field observations show how the soil responded. The connection between them becomes clearer when you repeat the assessment.
Walk the field and give observations a record
Choose representative observation locations you can return to, plus separate locations for a specific trouble spot. Photograph them from the same position and include a ruler or another scale when documenting roots or soil layers. A wet depression, a headland, and the main field each deserve their own record [3].
Field observations worth repeating
| What to examine | What to record | How to interpret it |
|---|---|---|
| Water after rain | Ponding, runoff routes, sediment, rainfall amount, and time since rain. | Follow recurring trouble spots. Check drainage and landscape position when ponding persists. |
| Surface condition | Crusting, rills, exposed roots, residue cover, and establishment gaps. | Look for less sealing and soil movement under comparable events. |
| Roots and structure | Root depth and direction, visible pores, and the depth of dense or platy layers. | Look for roots using more of the profile. Dig where they turn sideways or stop. |
| Water entry test | Method, starting moisture, water amount, elapsed time, and repeated locations. | Compare repeated measurements made under similar starting conditions. |
| Soil organisms and residue | Visible organisms, residue type and age, season, and moisture. | Use these observations to help explain the field’s biology and decomposition. |
A quick infiltration demonstration can reveal a difference worth investigating. For tracking, use a defined procedure and repeat it at several locations. Water entry depends on initial moisture, cracks, soil type, and the test setup. Preserve those details with the result [11].
Likewise, record the conditions when assessing compaction. Penetration resistance rises as soil dries. Check a suspected layer by digging and looking at roots and structure. SHE’s soil-compaction diagnosis guide provides a fuller field sequence [2].
Earthworms and their channels can be useful supporting observations where they occur. Their abundance depends on habitat, season, and moisture, and some environments naturally support few. Compare a consistent volume of soil under similar conditions [11].
Choose a small set of tests you can repeat
A broad North American study evaluated more than 30 measurements at 124 long-term agricultural research sites. Bagnall and colleagues recommended soil organic carbon, aggregate stability, and 24-hour carbon mineralization as a practical minimum suite for assessing management-related soil function. Use that suite as a starting point, then add measurements that address your field’s particular concern [4].
Match the measurement to the question
| Measurement | What it helps you track | What to keep with the result |
|---|---|---|
| Organic matter or organic carbon | The longer-term condition of the soil’s organic material or carbon pool. | Which quantity was measured, method, units, depth, and sampling area. |
| Aggregate stability | How well soil aggregates resist breakdown under the test’s wetting or disturbance. | Exact method and sample preparation; use the same procedure again. |
| Carbon mineralization or respiration | Microbial processing of carbon under defined incubation conditions. | Incubation length, preparation, temperature, moisture protocol, and reporting units. |
| Routine fertility tests | pH and nutrient status relevant to crop response and input decisions. | Extractant, units, crop, sampling depth, and regional interpretation. |
| A targeted physical test | A specific constraint such as compaction or restricted water entry. | Location, depth, texture, moisture, and the measurement procedure. |
If your existing fertility package includes organic matter, keep that history. Soil organic matter and soil organic carbon are related quantities, but report them separately. For carbon storage per acre, ask for a stock assessment that includes bulk density, depth, and any required coarse-fragment or soil-mass adjustments [5].
More specialized tests can answer more specialized questions. POXC follows a carbon fraction sensitive to management; PMN follows potential nitrogen release under a laboratory procedure. PLFA can help investigate microbial biomass and community patterns. Choose an additional test when you can explain what its result will help you assess. SHE’s POXC, PMN, and PLFA guides explain those measurements in more detail [4][5].
Make the samples comparable before comparing the numbers
Sampling design can change the apparent trend. University of Wisconsin guidance identifies sampling month, depth, field location, handling, and laboratory procedure as major sources of variation. Keep those factors as consistent as practical [6].
- Area: map the sampling zone and repeat the same collection pattern. Keep distinct soils, drainage conditions, and management histories separate [3].
- Depth: agree on the depth required for each test and purpose. Record it and keep it consistent; a shallower sample can emphasize surface organic material.
- Timing: use a repeatable seasonal or crop-stage window. Record recent rainfall and the timing of manure, fertilizer, tillage, and grazing.
- Collection: use representative cores and a consistent approach to rows, bands, and traffic lanes. Remove surface litter according to the protocol.
- Handling: follow the laboratory’s instructions for the selected assays and record any shipping delay or exposure to heat.
- Analysis: retain the laboratory, exact method, units, and score version. Confirm those details again when ordering the next test.
If you change laboratories, arrange an overlap: collect and homogenize a representative sample, then send subsamples to both labs using matching requested methods and handling. That comparison can identify a reporting shift. It does not measure how much the field varies; independent field samples are needed for that [6][10].
If you have no reliable baseline, establish one now. Preserve older reports with their sampling details, but begin a new comparable series when those details are missing. A well-documented starting point gives the next result meaning.
Read a change in the context of its variability
Put the raw results beside one another, with their units and methods, before reading the score. Ask the laboratory which differences exceed its analytical repeatability, and ask your adviser how to assess variation among independently collected samples. Both matter when judging a small change [6][10].
Use plain descriptions in your record: “higher in this sample,” “a repeated increase across comparable samples,” or “no clear trend yet.” These descriptions match different amounts of evidence. A single composite sample represents a sampling area, but it provides little information about the spread of values within that area [3][10].
A score adds another layer of interpretation. Find out which indicators it contains, how they are weighted, and which reference population sets the rating. Read the components separately when an overall score moves unexpectedly. The useful question is which function changed and whether that change matters in your soil [5][12].
Expect different indicators to move on different timelines
Water entry, root distribution, and biologically active fractions can respond on a different timeline from total organic matter. Organic matter usually changes slowly, and the detectable response depends on starting level, texture, climate, management, and measurement precision [7].
University of Minnesota guidance gives illustrative expectations of roughly 3–5 years for organic-matter change in soils starting at 0–2%, and 7–10 years or more in soils starting at 4–7%. These are expectations from that guidance, not deadlines for an individual field. Wisconsin guidance also describes a multi-year monitoring horizon for many indicators [7][8].
A practical plan is to record field observations and operations each season, then agree with your adviser on a laboratory interval that fits the indicator, expected change, and budget. Use consistent annual testing where the question or program warrants it. For slower indicators, a planned multi-year revisit can be more informative than reacting to every small annual movement.
Protect a field that is already functioning well. Maintaining its condition through intensive production or difficult weather can be a meaningful result even when the laboratory numbers remain stable.
Use a reference that belongs to your soil
A sandy field in a dry climate and a fine-textured field in a wetter climate have different starting conditions and attainable ranges. Use your field’s own comparable history to assess direction. Use a matched reference to put its current condition in context [3][7].
For an external comparison, check texture, climate, drainage, landscape position, sampling basis, and the reference’s land-use history. A nearby grass strip may have received sediment, nutrients, or different traffic. Verify its suitability before treating it as a target [12].
SHE’s guide to fair soil-health targets explains ecological matching and reference selection. Use the benchmark to identify a relevant direction for improvement, while considering what is feasible in your production system.
Separate a field trend from the effect of one practice
A repeatable trend tells you what happened in the field. To identify the effect of a cover crop, grazing change, or other practice, you also need a fair comparison. Weather, crop rotation, inputs, and drainage changes can affect the same outcomes [10].
Where practical, establish a replicated comparison with your usual management, randomize treatment placement, and keep the other operations consistent. Collect baseline measurements and revisit both treatments in the same sampling window. An on-farm research adviser can help size the trial and choose the analysis. Iowa State recommends at least four replications as a starting point for its on-farm trial guidance [10].
Several cores mixed into one bag improve representation of that sample. They do not create several independent treatment replications. Nor does retesting the same bag. Independent plots or strips are the units that help you distinguish a treatment response from field variability [14].
Work through mixed results instead of averaging them away
When the evidence points in different directions
| What you see | What to check next |
|---|---|
| Better rooting and water entry, with little organic-matter change | Confirm conditions and locations. Keep tracking the physical improvement while following the slower carbon indicator. |
| Higher respiration after a recent manure application | Record the input timing and repeat at the planned window before interpreting it as a lasting trend. |
| Higher organic matter, with rising phosphorus or salts | Review amendment nutrient loading and crop-specific fertility or salinity guidance. |
| A lower score after a laboratory or depth change | Compare methods, units, sampling basis, and score version; establish an overlap or a new baseline. |
| Poor growth despite favorable biological results | Investigate rooting restrictions, moisture, disease, pH, and crop nutrient status. |
| No clear change after several comparable visits | Check practice establishment, measurement choice, and the size of change the sampling design could detect. |
For nutrient decisions, use the soil test and regional recommendation calibrated for that crop and soil. If a report supplies an estimated nitrogen credit, ask how it was validated locally before changing a fertilizer rate. SHE’s Haney guide helps separate measured results from estimated credits [9].
Follow the benefit through to the farm
Choose the outcome that matches the original problem: fewer establishment gaps, less sediment leaving the field, improved access after wet weather, more consistent forage recovery, or a change in yield variability. Record production and costs alongside the soil measurements [13].
For each season, note the weather, cultivar or forage mix, planting and harvest timing, irrigation, and major input changes. Compare costs using the same basis: seed, labor, machinery passes, fuel, testing, and any additional treatment. If you receive a conservation payment, show the result with and without that payment so you can judge continuing the practice.
SHE’s farm-value guide provides a way to connect measured soil functions to costs, production, and risk. Good economics strengthens the case for a practice; the soil measurements tell you whether its effect on the soil is also improving.
Build a record you can use next season
Choose one field and one priority concern. Make the monitoring plan simple enough to repeat:
- State the goal: name the field problem and the change you want to see.
- Map the comparison: record the sampling zones, observation points, and any treatment or reference areas.
- Choose the evidence: select relevant field observations, a small test set, and a farm outcome.
- Fix the protocol: save depth, seasonal window, method, units, sample handling, and laboratory details.
- Record the context: keep photographs, weather, crop stage, recent inputs, and management operations with the report.
- Schedule the review: decide when to repeat the assessment and which result would lead you to continue, investigate, or adjust.
Keep those records together in a notebook, spreadsheet, or FieldLog. A laboratory number is easier to use when you can see where it came from and what happened around it. SHE’s soil-sampling guide can help you set up the collection plan.
At the next review, you should be able to explain the result in farm terms: where water entered better, whether roots passed the restrictive layer, which comparable measurements changed, and what the change meant for the operation. That is how “the soil seems better” becomes a conclusion you can build on.
Have results that tell different stories? Bring SHE your crop, location, sampling depth and date, laboratory methods, recent management, and the field problem you are trying to solve. Those details make the question useful to an expert—and the answer useful to your farm.