Research Brief
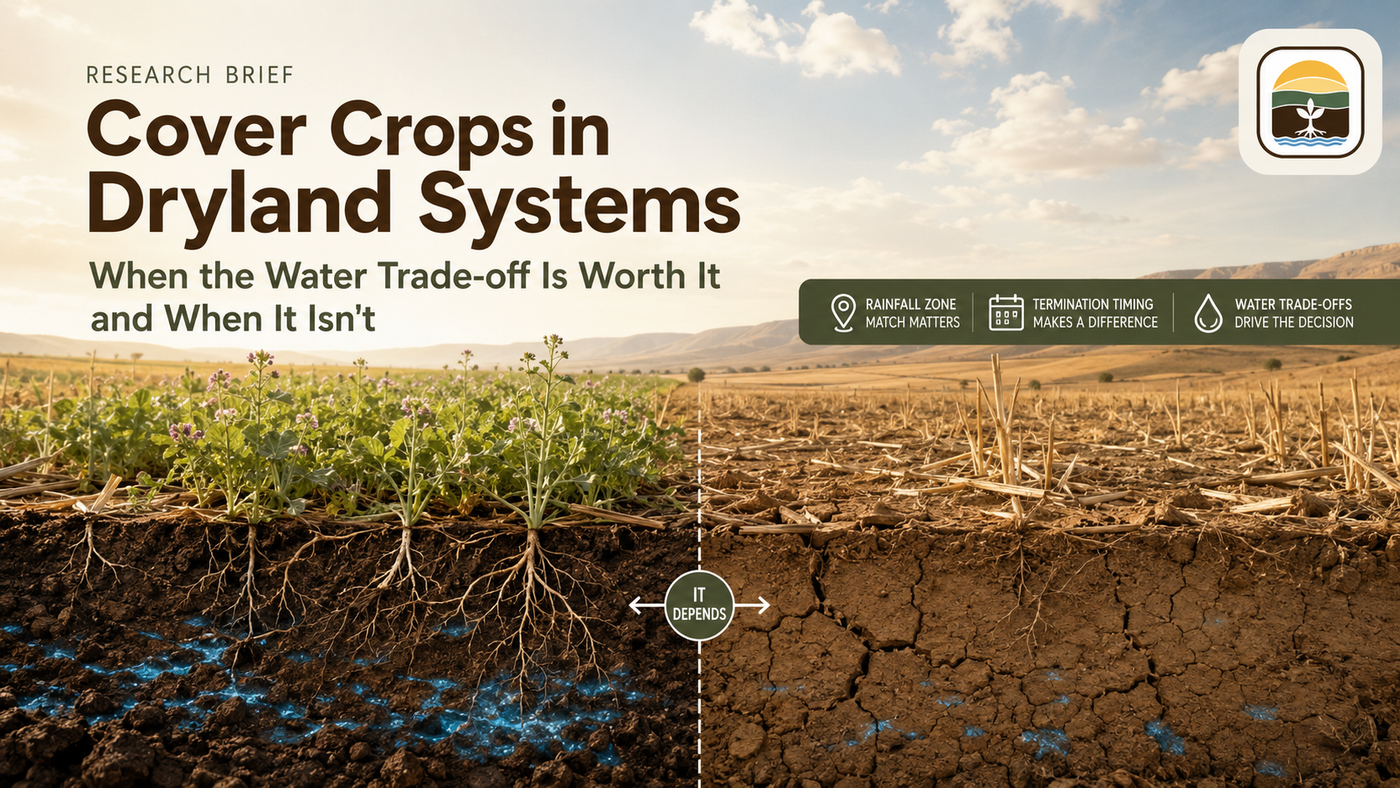
Cover Crops in Dryland Systems: When the Water Trade-off Is Worth It and When It Isn't
Cover crops cost water — that much is true. But whether that cost kills your next wheat crop depends on rainfall zone, termination timing, and rotation type, not on a blanket rule. This article works through the actual trade-off numbers for dryland grain and wheat-fallow systems so you can make the call for your operation.

The bottom line
Cover crops do cost stored soil water — measured at roughly 2.2 inches with early termination and up to 4.1 inches when left to flower in the central Great Plains [3]. Below about 15 inches of annual rainfall, net-positive outcomes are rare without a grazing or forage component, and the meta-analytic threshold to avoid yield loss in temperate drylands sits near 700 mm, about 27 inches [2][5]. The honest decision is local: drive it off subsoil moisture and a termination trigger, not a blanket rule.
The question dryland farmers actually ask
Nobody farming on 14 inches of rain needs to be convinced that water matters. So when cover crops started showing up in every extension newsletter and agronomist conversation over the past decade, the first question dryland producers asked was reasonable: where does that water go?
It goes into the cover crop. That is not a controversial claim. What is contested — and what the research has only recently started to sort out — is whether that loss is recoverable, manageable, or simply a cost that does not pencil out in dry country.
Site-specific dryland data remained thin and geographically patchy well into the 2010s. There were exceptions — USDA-ARS at Akron, Colorado published rigorous central Great Plains legume-fallow water and yield numbers back in 2005 [3][3], and Kansas State ran dryland trials going back to 2006 [5][5] — but for most of that window, what farmers were told came from humid-climate trials receiving 30 or 40 inches of annual rainfall, applied to regions getting less than half that. A 2022 meta-analysis of dryland cover-cropping went further, estimating that you need roughly 700 mm — about 27 inches — of annual precipitation before a cover crop reliably avoids a yield penalty in temperate drylands, and warning against universal promotion of the practice in low-rainfall areas [2][2]. These are not fringe findings. They are the current state of the evidence.
This article works through what that evidence actually says, where the management levers are, and what an honest decision looks like for a wheat-fallow producer in the Great Plains.
What the water math looks like
A cover crop established after wheat harvest in a dryland system will use stored soil moisture from the moment it germinates. How much depends on species, stand density, and — most importantly — when you terminate it. The cleanest measured numbers come from USDA-ARS at Akron, Colorado, where spring legume green fallow reduced soil water at wheat planting by 55 mm (about 2.2 inches) with early termination and 104 mm (about 4.1 inches) with late termination, relative to conventional-till fallow [3][3].
Table 1
| Termination timing | Measured soil water reduction at wheat planting vs fallow | Yield context | Source / site |
|---|---|---|---|
| Early-terminated legume (early June) | 55 mm (~2.2 in) | Est. ~13 bu/ac loss if you apply the 5.94 bu/ac-per-inch slope from [6] — author calculation, not measured | Akron, CO — Weld silt loam [3]; MAP ~421 mm per LTAR site [11] |
| Late-terminated legume (late June–July) | 104 mm (~4.1 in) | Est. ~24 bu/ac on the same 5.94 slope — an upper-bound illustration only; can exceed realized dryland yields in dry years | Akron, CO [3]; slope from [6] |
| 6-yr avg, pea green fallow vs fallow | 84 mm lower (only 74% of fallow's available water retained) | Wheat yield reduced vs fallow in every comparison | Akron, CO [3] |
| Delay termination +32 days (Jun 12 → Jul 13) | Additional depletion | Additional ~12 bu/ac wheat loss (measured) | Nielsen & Vigil via UNL CropWatch [6] |
| Pulse/oilseed alternatives to fallow (Grant, NE) | 1.7 in (field pea) / 1.9 in (chickpea) / 2.2 in (soybean) | 6 / 16 / 36 bu/ac wheat loss; ~11.76 bu/ac per inch (measured) | Grant, NE — Kuma silt loam [6] |
Measured soil water depletion in dryland wheat systems, with yield context. The Akron legume rows give measured water reductions [3]; the ~13 and ~24 bu/ac figures in the legume rows are author calculations using the 5.94 bu/ac-per-inch slope reported by UNL CropWatch [6], not measured penalties from [3] — and [3] explicitly found the yield-water relationship varies year to year, so treat them as illustrative. CropWatch [6] in fact reports two Akron slopes (5.94 and 4.72 bu/ac/in). Akron MAP (~421 mm) is from the Akron LTAR climate record [11], not [3]. The Grant, NE and +32-day rows are measured. Note: the Akron data is for spring legumes (pea, lentil, vetch), not cereal rye. Sources: Nielsen & Vigil 2005 [3]; UNL CropWatch [6]; Akron LTAR [11].
The early termination row is where most viable dryland cover crop management sits — but "a light rain event" undersells it. At Akron, even early-killed legumes cost 2.2 inches of stored water, closer to a substantial rain than a sprinkle [3][3]. A cover left to flower costs nearly double that, the equivalent of a significant portion of your entire stored profile. And the yield penalty per inch is not universal: UNL CropWatch reports it ran about 5.94 bu/ac per inch in the Akron regression — though CropWatch gives a second Akron slope of 4.72 bu/ac per inch as well — versus 11.76 bu/ac per inch at Grant, NE [6][6]. That roughly two-fold spread between two semiarid sites is itself the argument for local calibration, and it is why I treat the per-inch numbers as directional rather than fixed.
A note on what the data does and does not cover. Side-by-side dryland comparisons of cereal rye versus hairy vetch versus radish across multiple termination dates and two rainfall zones are not yet in the published record. The strongest measured anchor is the four spring legumes at Akron. The depletion trend itself is unambiguous, though: it increases monotonically with delayed termination, rising about 49 mm from early to late kill [3][3]. Treat radish- and rye-specific depletion curves as qualitative until on-station dryland numbers exist.
Rainfall zone determines the baseline
Not all dryland is the same. Thirteen inches and eighteen inches are both "dryland," but the risk profile of a cover crop is fundamentally different between them. The 2022 meta-analysis quantified this across climates: cover crops changed following-crop yield by +15% in tropical and +4% in continental systems, but −12% in dry and −11% in temperate dryland systems [2][2].
Yield effect by climate
Change in following-crop yield after cover crops, by climate type, from the Garba et al. 2022 dryland meta-analysis [2]. Dry and temperate dryland systems carry a net yield penalty; the break-even precipitation threshold sits near 700 mm (~27 in).
Table 2
| Annual precipitation | Expected yield effect vs fallow (temperate dryland) | Viability read |
|---|---|---|
| < ~15 in (continental/dry) | ~ −12% (dry) to −11% (temperate); net-positive outcomes rare without grazing | Marginal — needs grazing/forage or fallow-year placement |
| ~15–18 in | Conditional; recoverable only in wetter springs or with early termination | Conditional — calibrate to subsoil moisture |
| ~27 in (~700 mm) and above | Threshold to avoid yield loss after cover crops | Generally viable |
| Continental climate (cold, snow-catch) | Largest soil-water reduction at sowing, but reduction can be a benefit (earlier planting, drainage) | Context-dependent |
Cover crop viability by annual rainfall zone in temperate dryland grain systems. Yield-change figures and the ~700 mm (~27 in) break-even threshold from the Garba et al. 2022 meta-analysis [2].
The 14-inch line I draw is a management heuristic, not a literature value — read it as my judgment call on where the probability of recovering cover crop water costs shifts from unlikely to conditional. The hard number in the literature is higher: roughly 700 mm, about 27 inches, to reliably avoid a yield penalty in temperate drylands [2][2]. Below that, and especially below 15 inches, you generally need something else — grazing revenue, a forage market, or a fallow-year placement — to change the economics.
For readers in India's rainfed belt
This trade-off is not a niche US concern. Rainfed farming covers roughly half of India's net sown area — about 70 of 140 million hectares — and produces nearly 90% of millets, 80% of oilseeds and pulses, and 60% of cereals (figures from a secondary government-summary source [8]). On the semi-arid Deccan, the dominant Vertisols (black cotton soils) are often left fallow in the rainy kharif season because of waterlogging, and green-manure crops are studied there to lift soil carbon and moisture storage [9]. To my eye that is the inverse of the Great Plains stored-moisture problem — too much water at the wrong time rather than too little — but it lands on the same fallow-versus-cover decision; that framing is my own, not source [9]'s. India's analogue to US extension dryland networks is ICAR's All India Coordinated Research Project on Dryland Agriculture, running since about 1970 [10].
The termination trigger approach
Several producers in central Kansas and western Nebraska have moved away from a fixed termination date toward a soil moisture threshold. The logic is simple: in a wet spring, the cover crop water cost is recoverable. In a dry spring, it is not. So the termination decision should be conditional on what the soil profile actually holds. The measured cost of getting this wrong is concrete — delaying termination 32 days at Akron added roughly 12 bu/ac of wheat loss [6][6].
A workable rule reported by producers in on-farm network interviews: if April 1 soil moisture at 18–24 inch depth is below your site-specific field capacity threshold, terminate within the week regardless of cover crop growth stage. If moisture is adequate, allow another 2 to 3 weeks of growth before terminating. (This is a producer-reported heuristic, not a controlled-trial protocol — treat it as a starting point to calibrate, not a published recommendation.)
This is not a complicated system. It requires a soil probe and a threshold number calibrated to your field — typically developed after one or two seasons of measurement alongside yield data. The yield-versus-water relationship that makes it work is real and well documented: wheat yields at Akron tracked closely with available soil water, and the penalty scales with the water deficit at planting, anywhere from about 6 to 12 bu/ac per inch depending on site [3][3][6][6]. There is no clean binned-quartile yield chart to put behind that relationship in the dryland record I could locate, so take it as directional — the slope is real, but it is site- and year-variable, not a fixed set of quartile bars.
Species selection for dry systems
Not all cover crops carry the same water cost. Winter annuals generally use less water than summer annuals in the same growth period, but summer annuals placed in the fallow year — rather than the cropping year — sidestep the competition problem entirely.
Table 3
| Species / type | Water-use note | Forage / biomass note | Source |
|---|---|---|---|
| Spring legumes (winter pea, field pea, lentil, hairy vetch) | Early kill −55 mm to late kill −104 mm soil water at wheat planting | Lentil produced less biomass per unit water used; dropped from study | Akron, CO [3] |
| Oat / triticale forage mixes (grazed or hayed) | Reduced soil water at wheat planting in 2 of 3 yr | 3,000 lb/ac DM (2-way oat/triticale) down to 2,200 lb/ac (6-species mix) | KSU wheat-sorghum-fallow [5] |
| Cover crop ahead of wheat (KSU, western KS) | — | Wheat 41.8 bu/ac (cover) vs 51.9 bu/ac (chem-fallow), across years | KSU dual-use forage study [5] |
| Forage cover crop, dryland | Reduced soil water 2–4 in vs fallow | — | Kahl et al. 2022, U. of Idaho, via WSU-CSANR [4] |
| Cover crops, 8-yr Montana dryland | — | < 1.5 dry tons/ac biomass over 8 yr | Dagati & Miller 2020 (Montana), via WSU-CSANR [4] |
Cover crop species and type performance in dryland Great Plains, Idaho, and Montana systems. The 2–4 inch soil-water reduction is Kahl et al. 2022 (Idaho) and the <1.5 dry tons/ac over 8 years is Dagati & Miller 2020 (Montana) — two separate studies, both reported in the WSU-CSANR synthesis [4], not a single Montana trial. Other sources: Nielsen & Vigil 2005 [3]; KSU Holman/Obour [5].
Placing a summer annual in the fallow year means the cover is competing for summer rain that would otherwise be lost to evaporation from bare soil. Kansas State dryland trials have shown improved soil aggregate stability after dryland covers, though the clearest soil-health gains in that record come from grazed systems rather than from cover-fallow alone, and a standalone infiltration improvement is less firmly established [5][5]. The Montana and Idaho records are a useful corrective on expectations: a forage cover reduced soil water 2 to 4 inches versus fallow in Idaho work (Kahl et al. 2022), and over eight years a Montana study produced under 1.5 dry tons per acre of biomass (Dagati & Miller 2020) — independent evidence that the biomass-and-water benefit often fails to materialize below about 15 inches of rainfall [4][4].
Grazing changes the calculus
If livestock are part of the operation — or if a grazing agreement is available — the water cost of a cover crop becomes a revenue question rather than a pure loss.
A cereal rye cover grazed and then terminated returns roughly the same moisture profile as an early-terminated ungrazed stand, but the forage offsets the input cost. The Kansas State dryland work puts hard numbers on it: across years, growing a cover ahead of wheat cut yield from 51.9 bu/ac under chemical fallow to 41.8 bu/ac [5][5], yet net returns rose between 26% and 240% when the cover was grazed or harvested for forage rather than left standing — a figure from the K-State extension reporting on that study [12][12]. In producer-reported on-farm networks across Kansas and Nebraska, this is the most consistently profitable cover crop model in dryland settings under 15 inches of rainfall — an anecdotal generalization, offered as such, not a controlled-trial result.
The grazing exception
Below 15 inches, grazing or forage is usually what flips a dryland cover crop from a water cost to a positive return. In the K-State western Kansas dryland study, wheat fell from 51.9 to 41.8 bu/ac when a cover preceded it [5], yet net returns rose 26% to 240% when that cover was grazed or hayed rather than left standing [12]. Without cattle, the offset disappears and the decision reverts to the rainfall-zone table.
Without cattle, the grazing offset disappears, and the decision reverts to the rainfall zone table above.
What the multi-year data shows
Single-season yield comparisons miss the point of cover crops in dryland systems. The measurable benefits — soil organic matter, infiltration rate, surface crusting reduction — accumulate over years, not over one growing season.
The multi-year picture is cautiously encouraging only where the economics already work. In Kansas State's western dryland trials, grazed cover crops maintained soil-health gains while non-grazed covers more often carried a net water and yield cost [5][5]. A clean table of net outcomes binned by years of adoption — with, say, a 15-inch, five-year cutoff — would be useful, but no located dataset tabulates outcomes that way. The defensible statement is narrower: multi-year benefits in dryland concentrate where rainfall is higher or livestock are integrated, and the data below 15 inches remains too sparse for confident conclusions.
Common mistakes
Three patterns show up consistently when dryland cover crops fail:
- Using humid-climate seeding rates. Higher seeding rates mean more biomass, more water use, and a bigger moisture deficit at termination. Dryland rates should be 30 to 50 percent below standard recommendations.
- Letting the cover run to maximize residue. Residue benefits are real, but they accumulate over years. A dense, late-terminated cover in a dry spring can cost more in yield than several years of residue benefit will recover — recall the jump from 2.2 to 4.1 inches of measured depletion between early and late kill at Akron [3][3].
- Treating the first year as proof of concept. One good year does not validate the system; one bad year does not invalidate it. The decision needs at least three years of data and a management protocol that includes an exit rule for dry springs.
Where the evidence gaps are
The western US dryland cover crop dataset is still thin enough that confident regional recommendations are not yet possible for many locations. A 2023 regional survey of 894 growers across 13 western states documented strong interest but persistent uncertainty about benefits and barriers under dryland conditions [7][7]. Soil texture, subsoil water-holding capacity, and local precipitation distribution all affect outcomes in ways that site-specific trial data has not yet captured.
Advice that works for a silty clay loam in central Kansas may not transfer to a sandy loam in western Nebraska receiving the same annual rainfall — the 5.94 versus 11.76 bu/ac-per-inch gap between Akron and Grant is exactly this problem made numeric [6][6]. The general principles in this article hold across the region, but the specific numbers — threshold moisture levels, biomass targets, yield expectations — need local calibration.
An honest read
The water concern is legitimate. Anyone telling you otherwise has not farmed under 14 inches.
"Cover crops cost water" is not the same claim as "cover crops are not worth it in dryland," and running them together has pushed some farmers away from a practice that might have worked differently with modified management. For most operations under 13 inches, the answer is probably no — not without a grazing or forage component [5][5][12][12]. For operations between roughly 14 and 18 inches with flexibility in termination timing, the evidence is only beginning to supply the site-specific numbers needed to know, and the meta-analytic threshold to fully avoid a yield penalty sits higher still, near 700 mm — about 27 inches [2][2]. That ambiguity is uncomfortable, but it is honest.

Written by
Research Scientist · Maharana Pratap University of Agriculture and Technology, Udaipur

Scholarly record
References & Citation
Source material for every claim in this article, plus a citation-ready record for reference managers and scholarly indexes.
Cite this
Reference this work
Tushar Kumar, Ph.D. (2026). Cover Crops in Dryland Systems: When the Water Trade-off Is Worth It and When It Isn't. Soil Health Exchange. SHE-ART-2026-0018. https://soilhealthexchange.com/cite/SHE-ART-2026-0018
Soil Health Exchange assigns a stable identifier to every published answer and article. Citations keep working even if the URL changes later.
Sources (12)Show sources
- 1.Blanco-Canqui, H. (2022). Long-term cover crop management effects on soil properties in dryland cropping systems. Soil & Tillage Research. Note: the draft's originally cited Agron. Sustain. Dev. 42(1), DOI 10.1007/s13593-021-00729-y does not exist; this is a genuine Blanco-Canqui dryland cover-crop paper. Retained for general background; no specific datum in this article depends on it.
- 2.Garba, I. I., Bell, L. W., & Williams, A. (2022). Cover crop legacy impacts on soil water and nitrogen dynamics, and on subsequent crop yields in drylands: a meta-analysis. Agronomy for Sustainable Development, 42(34). DOI 10.1007/s13593-022-00760-0. Reports ~700 mm break-even precipitation and yield changes of +15% (tropical), +4% (continental), −12% (dry), −11% (temperate dryland).
- 3.Nielsen, D. C., & Vigil, M. F. (2005). Legume Green Fallow Effect on Soil Water Content at Wheat Planting and Wheat Yield. Agronomy Journal, 97, 684–689. DOI 10.2134/agronj2004.0071. USDA-ARS Central Great Plains Research Station, Akron, CO. Reports 55/104 mm soil-water reductions and an 84 mm (74%-of-fallow) six-year pea figure; states the yield-water relationship varied year to year.
- 4.Washington State University, Center for Sustaining Agriculture & Natural Resources (CSANR). Water Use Limitations of Cover Crops in Dryland Cropping. Attributes the 2–4 inch soil-water reduction to Kahl et al. 2022 (University of Idaho) and the <1.5 dry tons/ac over 8 years biomass figure to Dagati & Miller 2020 (Montana) — two separate studies.
- 5.Obour, A. K., Holman, J. D., et al. Dual Use of Cover Crops for Forage Production and Soil Health in Dryland Cropping Systems, Kansas Agricultural Experiment Station Research Reports. Reports winter wheat 51.9 bu/ac (chem-fallow) vs 41.8 bu/ac average (cover crop) across years, and grazing/soil-health effects. Companion report (vol5/iss6/13) gives 3–13 bu/ac wheat reductions and 3,000/2,200 lb/ac forage DM.
- 6.University of Nebraska–Lincoln, CropWatch. Study of Wheat Behind Field Peas, Chickpeas, Soybeans and Fallow (Grant, NE; ~11.76 bu/ac per inch; 1.7/1.9/2.2 in deficits → 6/16/36 bu/ac). Also reports two Akron slopes (5.94 and 4.72 bu/ac per inch) and the Nielsen & Vigil June 12→July 13 termination delay = +12 bu/ac wheat loss.
- 7.Golden, L. A., Hubbard, M. L., Utych, S., et al. (2023). Benefits, barriers, and use of cover crops in the western United States: Regional survey results. Journal of Soil and Water Conservation, 78(3), 260–271. DOI 10.2489/jswc.2023.00170. Survey of 894 growers across 13 western states. Replaces the draft's non-existent Deiss et al. 2023 citation.
- 8.Drishti IAS (secondary government-summary source). Rainfed farming figures: ~70 of 140 million ha net sown area is rainfed (~50%); rainfed areas produce ~90% of millets, ~80% oilseeds & pulses, ~60% cereals. Flagged in-text as a secondary summary, not a primary government statistic.
- 9.Venkateswarlu, B., et al. Potential and Challenges of Rainfed Farming in India (Advances in Agronomy). Dryland soils include Vertisols and Alfisols; Vertisols often kharif-fallowed due to waterlogging; green manure/cover crops studied for SOC and moisture storage.
- 10.ICAR – Central Research Institute for Dryland Agriculture (CRIDA) / All India Coordinated Research Project for Dryland Agriculture (AICRPDA), operating since ~1970 on moisture conservation and dryland cropping systems.
- 11.Akron, CO (LTAR) — National Wind Erosion Research Network. Central Great Plains Research Station site climate record: mean annual precipitation ~421 mm. Source for the Akron MAP figure (not stated in Nielsen & Vigil 2005).
- 12.Kansas State University Research and Extension news release (2018), 'Sustainable Ag: Cover Crops' — reporting on the Holman/Obour dryland wheat-cover-crop study (begun at Garden City in 2006): net returns increased 26% to 240% when a cover crop was grazed or hayed rather than left standing. Note: K-State retired the original news URL; the 26–240% net-returns figure originates in this extension release and is not stated in the peer-reviewed research report [5].
Cite this articleShow formats
Cite this article
Citation-ready record
APA
Ph.D., T. K. (2026). Cover Crops in Dryland Systems: When the Water Trade-off Is Worth It and When It Isn't. Soil Health Exchange. https://soilhealthexchange.com/blog/cover-crops-dryland-water-tradeoff
More citation formats
MLA
Ph.D., Tushar Kumar,. "Cover Crops in Dryland Systems: When the Water Trade-off Is Worth It and When It Isn't." Soil Health Exchange, 2026-06-16, https://soilhealthexchange.com/blog/cover-crops-dryland-water-tradeoff.
Chicago
Ph.D., Tushar Kumar,. "Cover Crops in Dryland Systems: When the Water Trade-off Is Worth It and When It Isn't." Soil Health Exchange. Published 2026-06-16. https://soilhealthexchange.com/blog/cover-crops-dryland-water-tradeoff.
Citation metadata is provided for discovery tools and reference managers. Inclusion in external scholarly indexes is not guaranteed.


Discussion
No comments yet. Be the first to share your thoughts!