Nematodes as Soil Health Indicators: What Can a Test Tell You?
Learn what nematode feeding groups and soil food-web indices reveal, how to collect a useful sample, and which crop and management decisions the results support.
SH
By Soil Health Exchange Editorial||13 min read|10 reads
A nematode report can put two very different results on the same page: evidence of a more developed soil food web and a warning about organisms feeding on your crop. Both can be true. The useful question is which nematodes were found, how they were measured, and what the result changes about your next decision.
Nematodes are roundworms. Many soil-dwelling forms are microscopic and live in the water films around soil particles. Their feeding habits place them at several points in the food web, from organisms grazing on bacteria to predators eating other animals. That range makes the community informative about soil biology [1][2].
Begin with the decision
For a crop-pest concern, order a diagnostic assay that identifies and quantifies the relevant plant-parasitic nematodes. For a question about the soil food web, request a community assessment with feeding groups and clearly defined indices. Compare repeated samples collected with the same protocol, and connect the findings to roots, soil conditions, and crop performance.
Five feeding groups give the count meaning
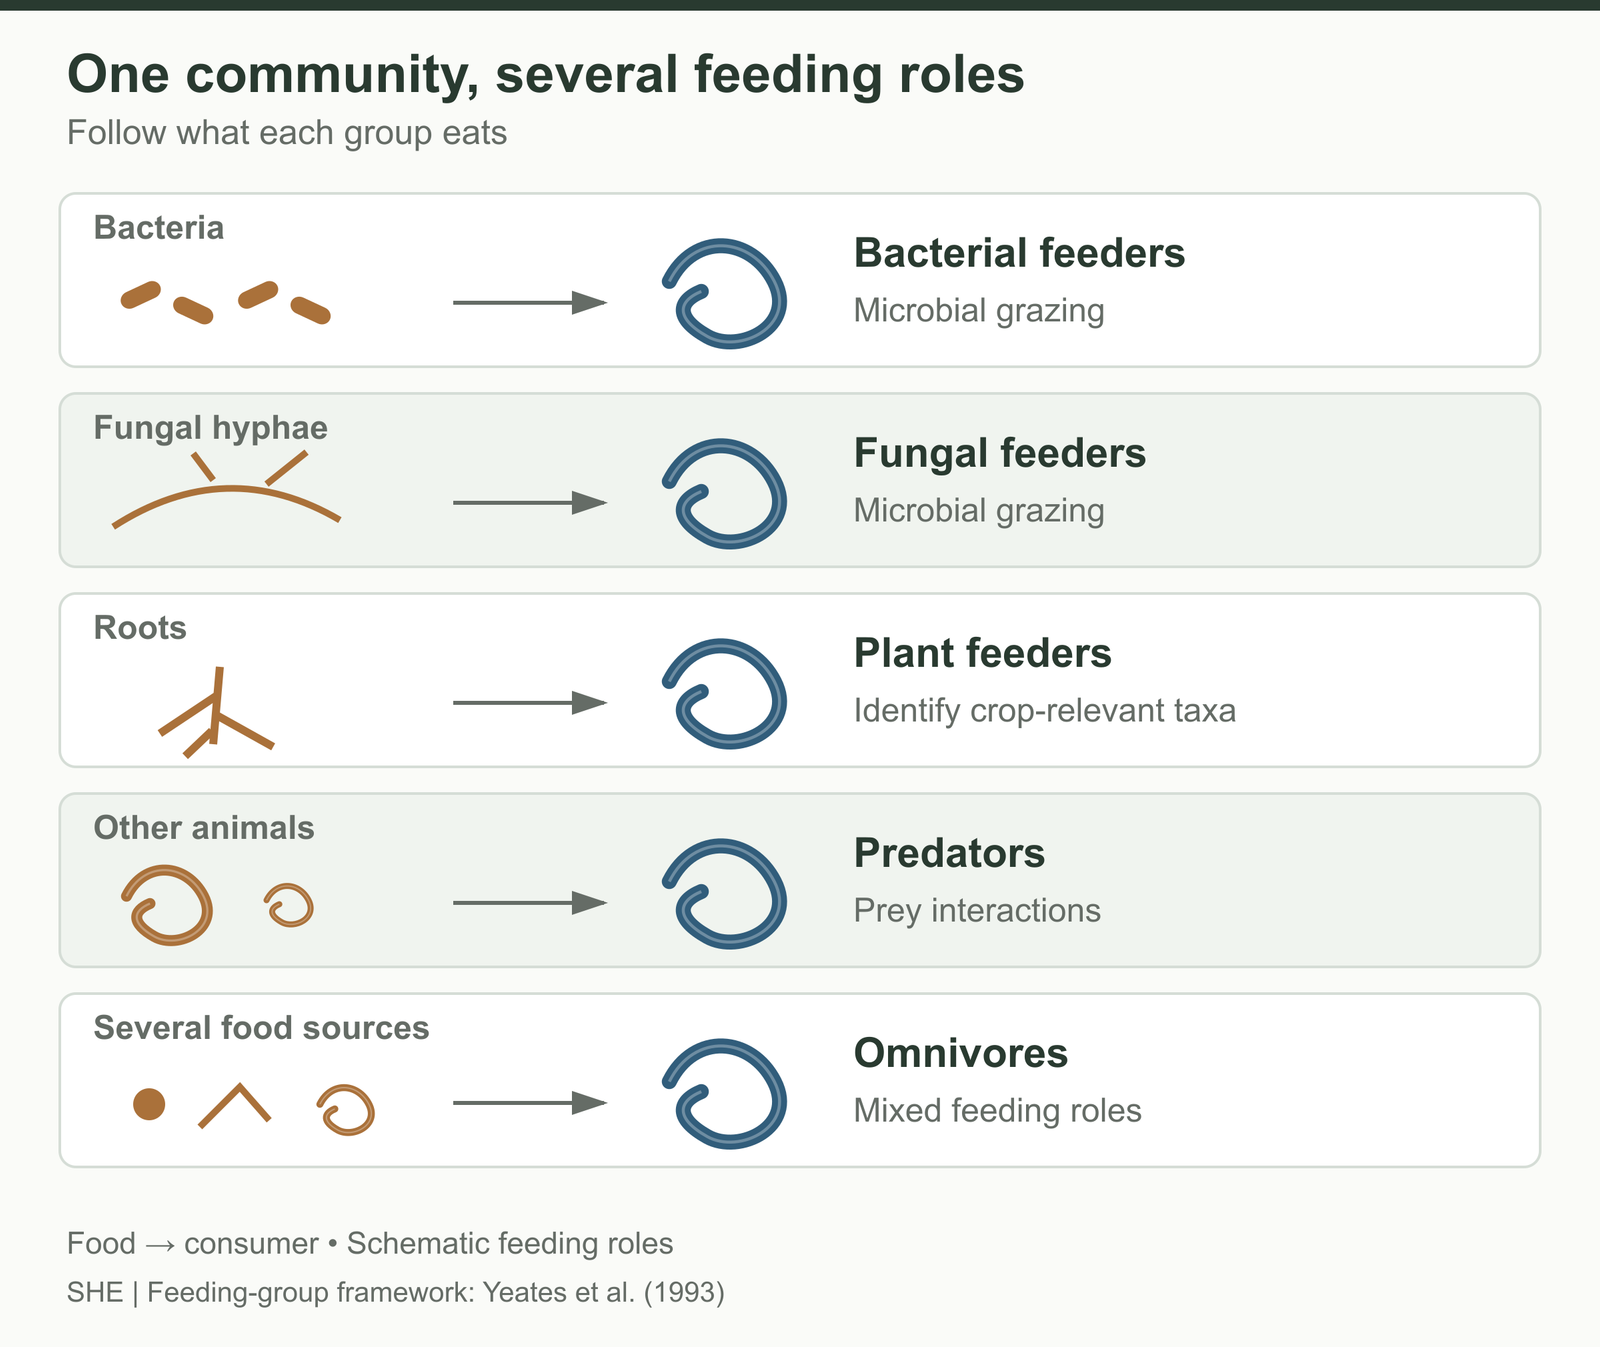
A community report commonly organizes nematodes into bacterial feeders, fungal feeders, plant feeders, predators, and omnivores. Feeding assignments come from identification and knowledge of the taxon; some groups have uncertain or mixed diets [1].
Swipe horizontally to inspect the full figure →
Click or tap to expand the figure
The five common reporting groups describe feeding roles. Arrows run from food to consumer; the drawings are schematic [1]. — Figure: Soil Health Exchange
Bacterial and fungal feeders graze on microbial populations. Predators feed on other animals, including nematodes. Omnivores use several food sources. Plant feeders warrant closer identification because crop risk depends on the particular nematode and its host, rather than the presence of the broad group alone [1][11].
Keep the abundance of each group beside its percentage. A community can change because one group increased, another declined, or both. Looking at the denominator prevents a shift in composition from being mistaken for population growth.
A percentage can rise while the count stays still
In an illustrative comparison using the same soil basis, 50 predators among 1,000 nematodes represent 5%. If the total falls to 500 while predators remain at 50, their share rises to 10%. The predator count is unchanged. Ask for counts per stated soil mass or volume as well as community percentages.
Choose a pest assay or a community assessment
Order the test that answers your question
Your question
What to request
What you need back
Could nematodes explain poor growth or threaten the next crop?
A crop-specific plant-parasitic nematode assay; soil and roots when appropriate.
Relevant identity, density, life stage, units, and crop-specific interpretation.
Has management changed the soil food web?
A nematode community assessment with feeding and life-history groups.
Group abundances or proportions, identification detail, indices, and sampling and analytical methods.
Are soybean cyst nematodes reproducing on the resistance we use?
Discuss an HG type test with a nematologist, alongside the population-density assay.
Reproduction on resistance sources and advice for variety and rotation choices.
Diagnostic sampling and crop management: NCDA&CS and NC State [10][11]. Community assessment: Virginia Tech [9]. HG type testing: Iowa State [13].
A laboratory that counts plant parasites may not offer a full food-web profile. Before collecting, confirm the service, price, turnaround time, sample volume, depth, shipping instructions, and the interpretation included. Virginia Tech’s community-analysis guidance is one example of an Extension service describing this broader assessment [9].
Click to expand
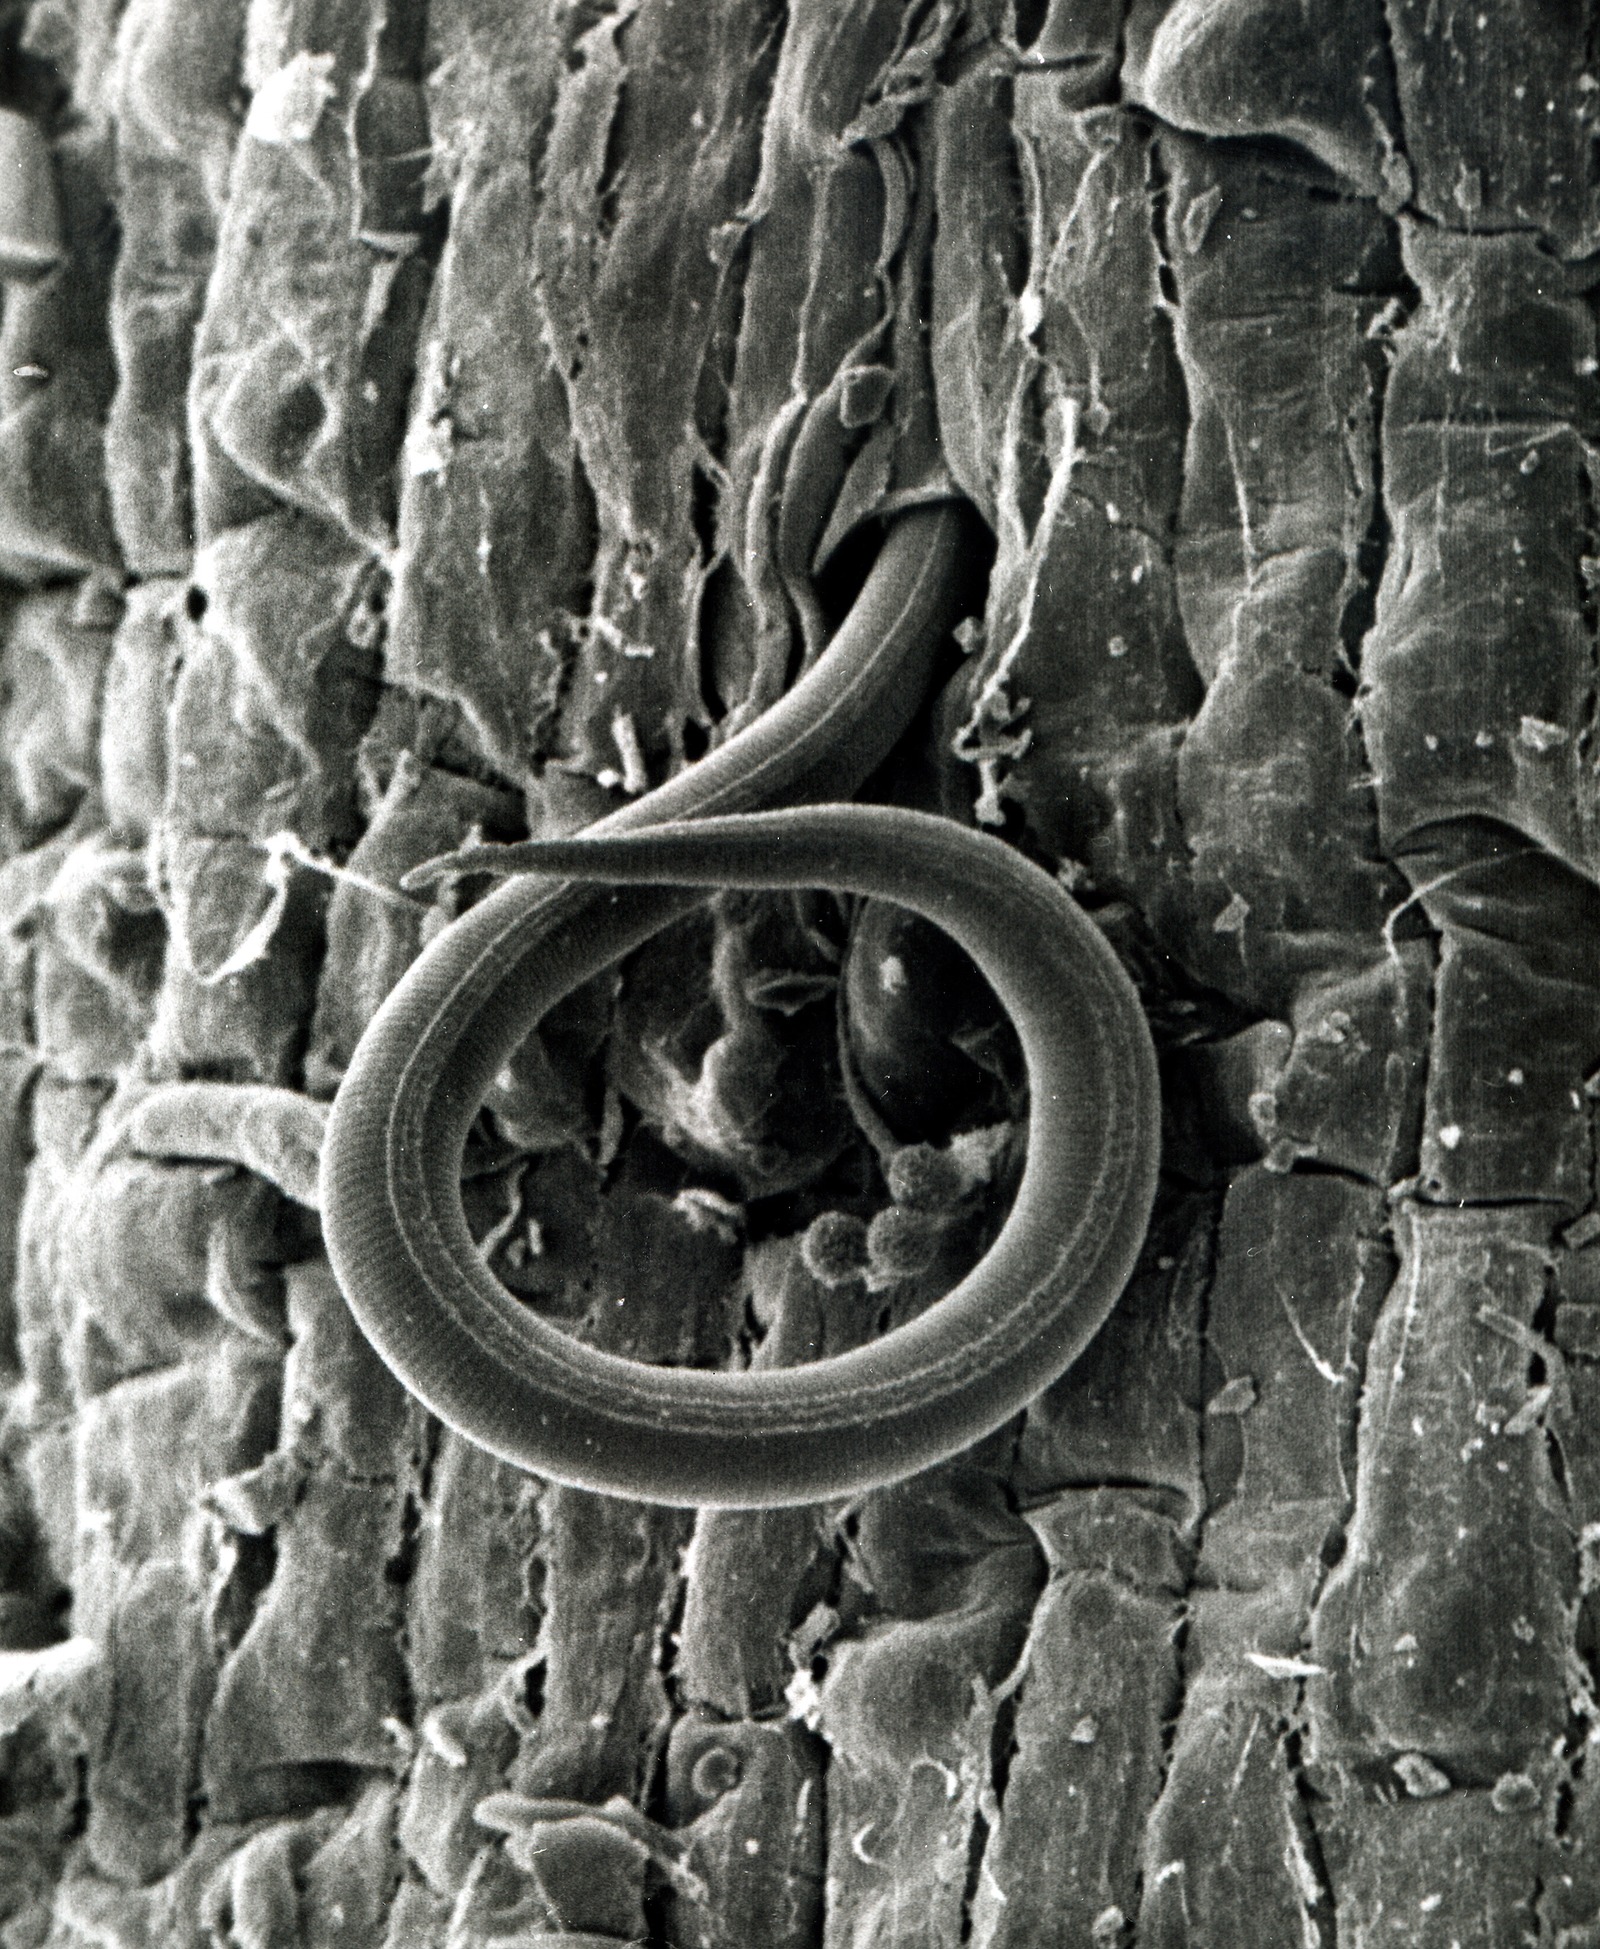
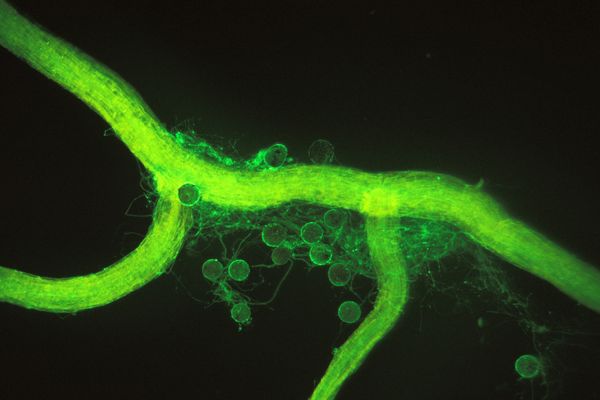
A root-knot nematode larva entering a tomato root, photographed at 500×. Identifying a plant parasite gives a pest assay its practical value [17]. — Photo: William Wergin and Richard Sayre / USDA Agricultural Research Service, PN-7171
Crop-pest reports may count juveniles, adults, eggs, or cysts, depending on the organism and assay. Preserve those labels. For soybean cyst nematode, an egg-density result answers a different question from an HG type test, which examines reproduction on sources of soybean resistance [13].
Read the indices as different questions about biology
Nematologists also group taxa along a colonizer–persister, or c-p, scale from 1 to 5. Lower values describe organisms with faster population responses; higher values generally describe longer-lived organisms more sensitive to disturbance. Combining feeding role with life history creates functional guilds [3].
A guide to common report abbreviations
Indicator
What it summarizes
How to use it
Maturity Index (MI)
The abundance-weighted c-p values of the included free-living taxa.
Read the balance of opportunists and persisters. Verify whether the lab reports MI or a variant such as MI2–5.
Enrichment Index (EI)
The weighted representation of guilds responding to resource enrichment.
Look for a resource response, then check recent inputs and sampling timing.
Structure Index (SI)
The weighted representation of guilds associated with a more structured food web.
Follow the pattern across comparable samples and management histories.
Channel Index (CI)
The relative representation of selected fungal and bacterial decomposition indicators.
Read the decomposition-channel signal alongside residue and microbial measurements.
Plant-Parasite Index (PPI)
The c-p composition of plant-feeding taxa.
Keep this ecological index separate from crop-specific pest density and risk.
Index definitions follow Ferris and colleagues and UC Davis Nemaplex [2][3].
EI, SI, and CI commonly use scales from 0 to 100; MI uses the c-p scale. A CI of 60 is an index calculated from selected guilds, rather than a measurement that 60% of all decomposition came from fungi. Ask the laboratory for the formula and taxon assignments behind unfamiliar scores [2].
Swipe horizontally to inspect the full figure →
Click or tap to expand the figure
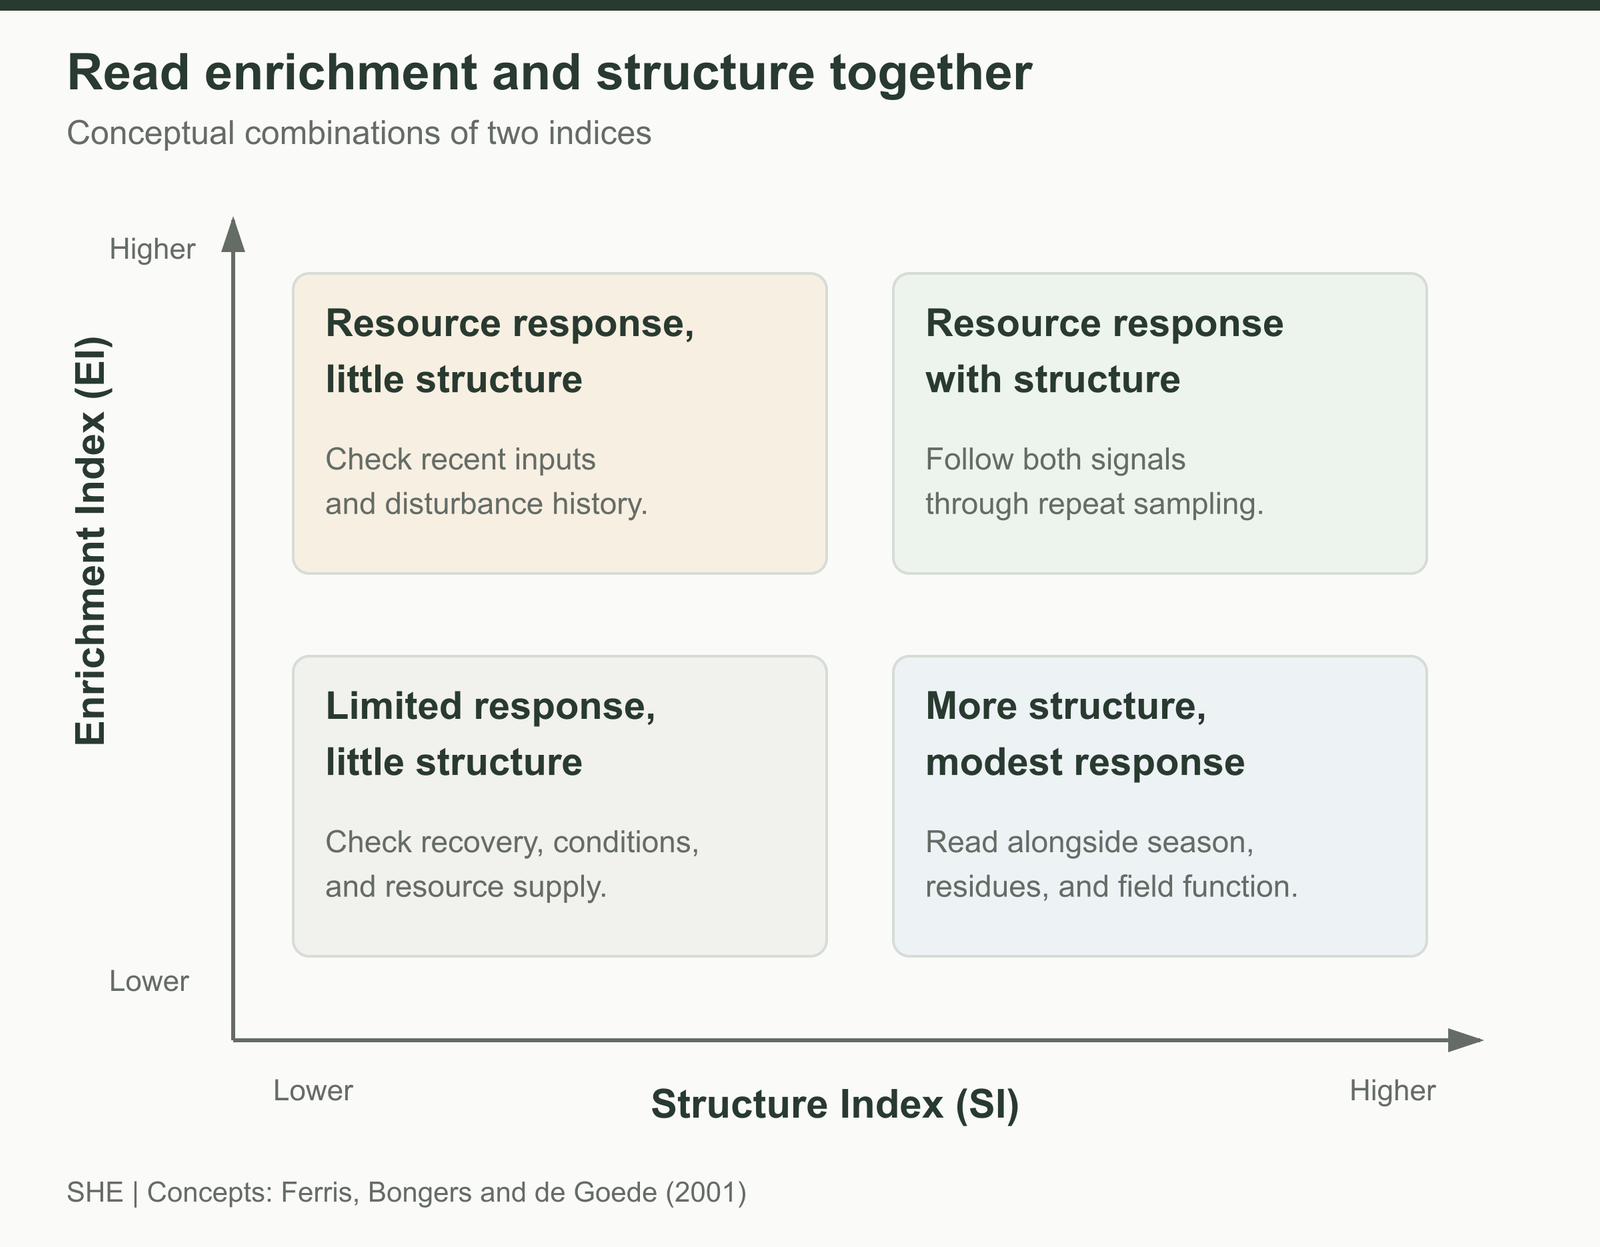
Read enrichment and structure together. These qualitative regions explain combinations of indices; local comparisons give a field result its meaning [2]. — Figure: Soil Health Exchange
A strong enrichment response can occur in a community with few persisters. A community with more structure can have a modest enrichment response at the sampling date. Choose the interpretation that fits the field question and retain the underlying groups [2].
The original MI excludes plant feeders; PPI examines them separately. A report using a broader index or a proprietary composite needs its own definition and reference population. Soil type and field context belong in that comparison, just as they do when interpreting other soil-health measurements [3][16].
What management experiments show
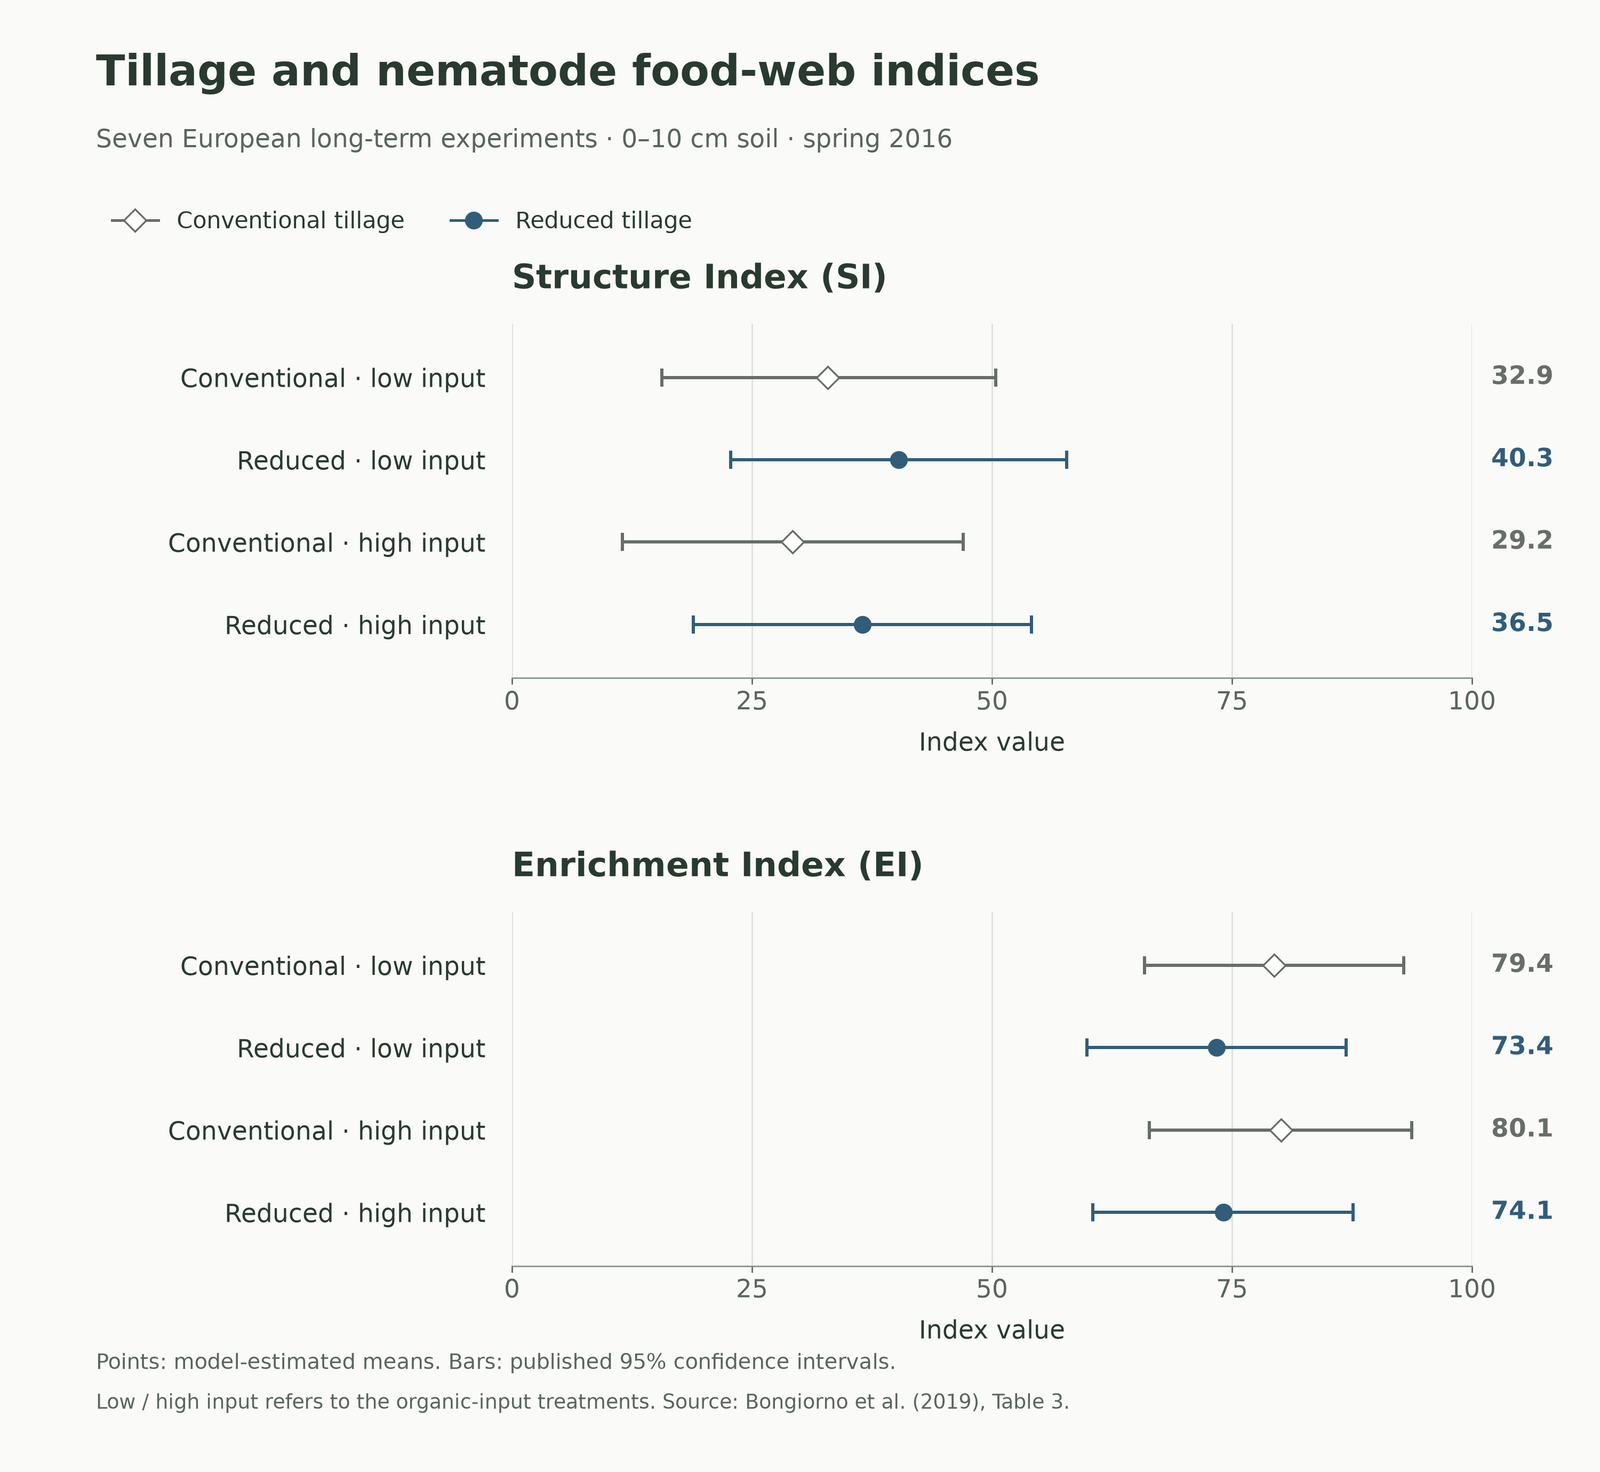
Bongiorno and colleagues examined nematodes in 10 European long-term experiments using molecular profiling. In the seven experiments contributing to the tillage analysis, reduced tillage had higher MI, SI, and CI than conventional tillage, while EI was higher under conventional tillage. Estimated plant-feeder abundance was also 70% higher under reduced tillage [4].
Swipe horizontally to inspect the full figure →
Click or tap to expand the figure
Topsoil results from the seven experiments in the tillage analysis, sampled in spring 2016. Points are model-estimated means; bars are their published 95% confidence intervals. The full model, including both soil layers, supported higher SI and lower EI under reduced tillage [4]. — Figure: Original SHE plots using Bongiorno et al. (2019), Table 3
The practical lesson is to retain both readings: the food-web pattern and the identity and density of crop pests. A higher structure index can be useful evidence in monitoring a management change while the next crop still needs a separate pest-risk assessment.
A global meta-analysis by Puissant and colleagues brought together 103 publications and 4,855 effect sizes. Responses differed among feeding groups and practices: organic fertilization promoted microbial feeders, while rotation reduced plant feeders in the pooled evidence. Cover crops also changed nematode communities. The time since an intervention and the length of practice adoption influenced responses [5].
Use those findings to choose a hypothesis worth testing locally. If you expect a cover crop to support a different community, decide which groups to follow and when to sample. If you expect pest suppression, measure the particular pest and check whether that cover-crop species and cultivar supports its reproduction [5][12].
Where correlation ends and causation begins
Three relationships matter: management can change the nematode community; nematodes can influence soil processes; and a nematode measurement can track a process that several organisms drive. Each relationship asks for different evidence.
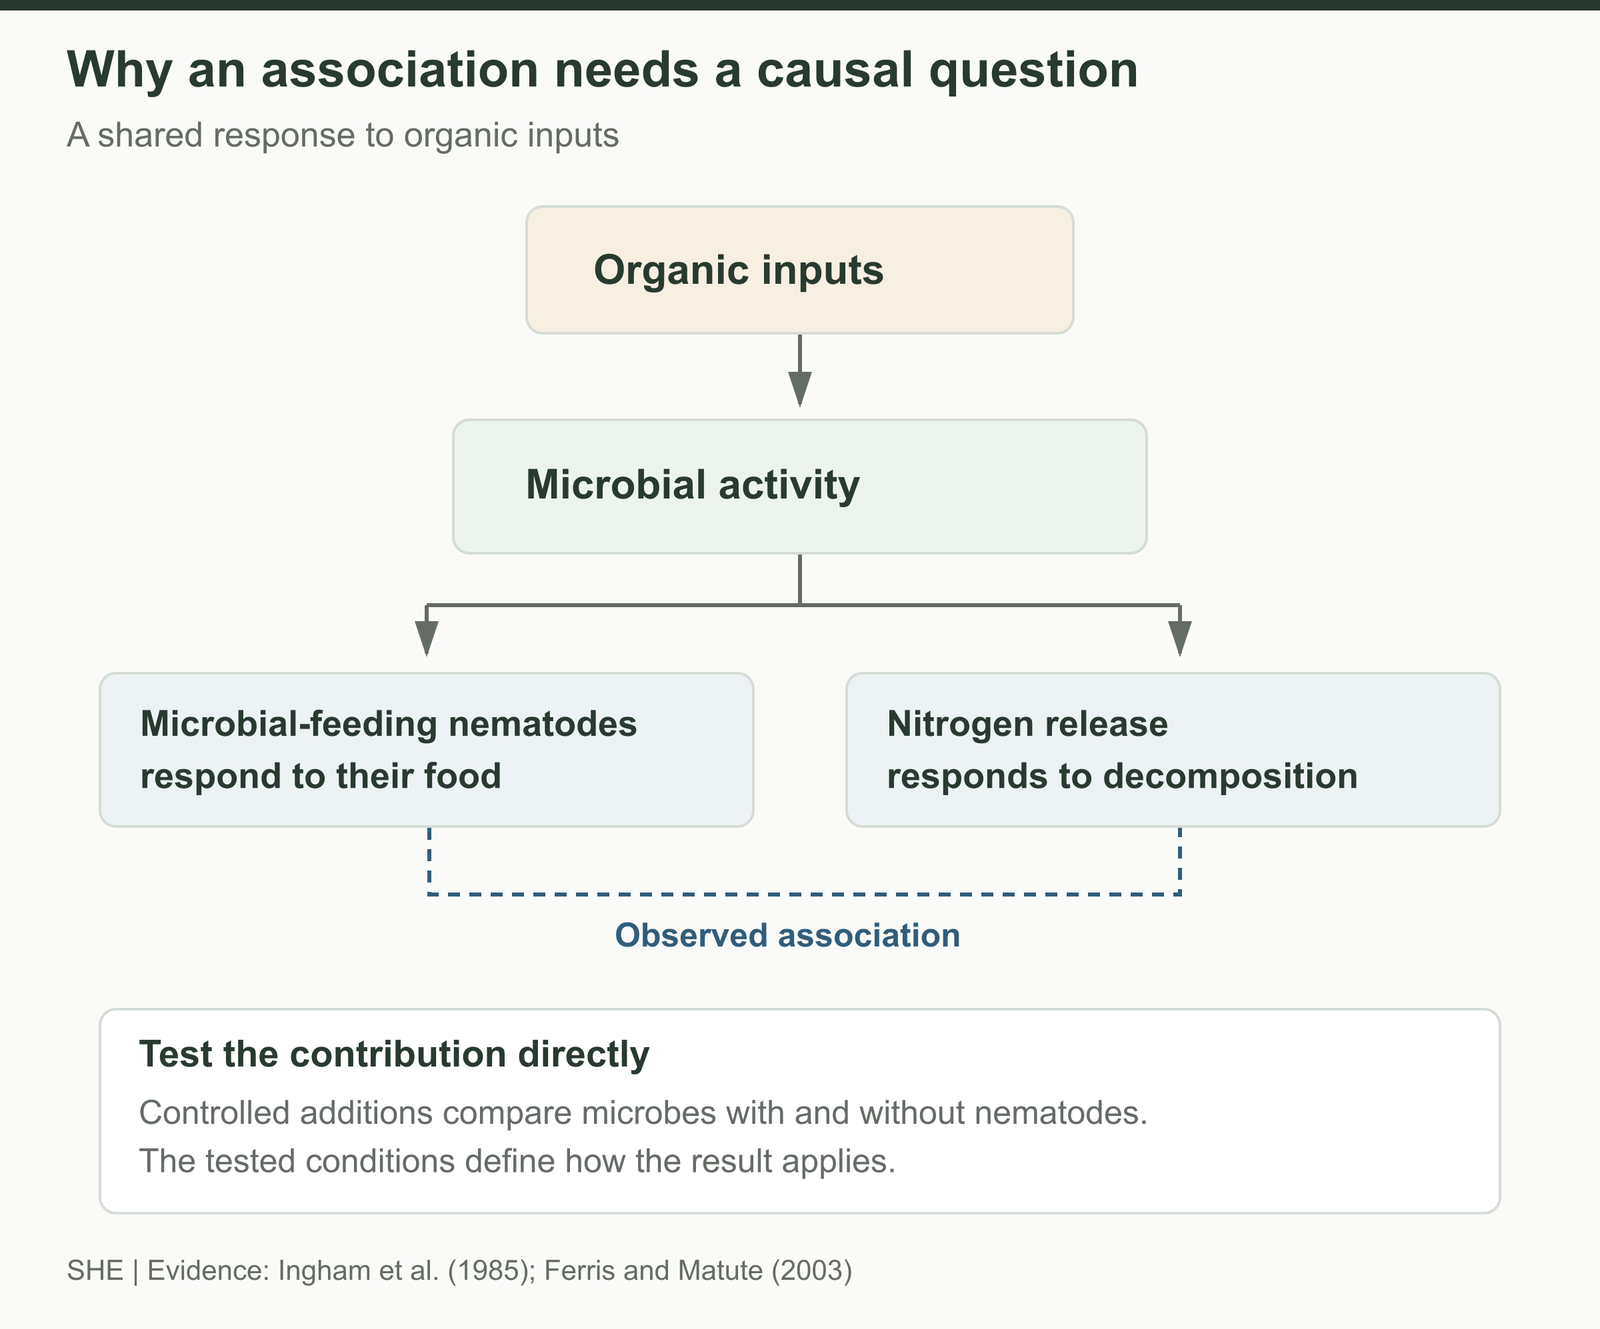
For example, Ferris and Matute studied vegetation-free microplots receiving different organic materials. Their average enrichment index was positively associated with cumulative mineral nitrogen, with a reported R² of 0.49. Both the nematodes and nitrogen release responded to the resources supplied and the activity of decomposers. That association made the index useful for following the process [7].
Swipe horizontally to inspect the full figure →
Click or tap to expand the figure
A shared resource response helps explain an association between nematodes and nitrogen release. Controlled additions test the contribution of nematodes themselves [6][7]. — Figure: Soil Health Exchange
Direct effects are supported by controlled experiments too. Ingham and colleagues added bacterial-feeding nematodes to simplified soil microcosms containing bacteria and blue grama grass. Plants initially acquired more nitrogen and grew faster than with bacteria alone. Adding fungal feeders did not produce the same growth response in that experiment [6].
That establishes a mechanism under the tested conditions. Turning it into a fertilizer-rate decision requires evidence about nitrogen supply and crop response in the relevant field system. Use locally calibrated nutrient recommendations and suitable nitrogen tests for that decision; the community profile helps explain the biology alongside them [15].
For a management question on your farm, compare replicated plots or strips, randomize the treatment within suitable blocks, and collect a baseline and comparable follow-up samples. Record crop, soil, weather, inputs, and outcomes. Several cores combined into one bag make one composite sample; independent treatment plots provide the replication needed to estimate a practice effect [14].
Collect a sample the laboratory can interpret
Arrange the protocol with the laboratory first. Community monitoring and pest diagnosis can require different sampling locations, timing, depths, and root material. For repeated monitoring, preserve the collection and laboratory methods; month, depth, field position, and handling can all change biological results [16].
Define the area. Map a zone with reasonably consistent soil and management. Keep distinct soil types, drainage areas, and problem patches separate.
Choose the window. For monitoring, repeat a comparable crop-stage or seasonal window and record recent rainfall, tillage, amendments, and crop history.
Collect the specified cores. Spread them through the zone and use the laboratory’s depth and volume. Virginia Tech’s community protocol specifies 20–30 sub-cores at 6–8 inches in the root zone and late-summer sampling [9].
Mix and label the sample. Use clean equipment, mix cores from the same zone, and record the zone, depth, collection date, crop, and purpose.
Protect the organisms. Keep the live-community sample field-moist and separate from soil being dried for other tests. Protect it from heat and follow the laboratory’s cooling instructions. Confirm any preservative required for a molecular assay.
Ship promptly. Virginia Tech requests cool, unfrozen samples and mailing within 24–48 hours. Confirm receipt arrangements before shipping [9].
For diagnosing poor growth, NCDA&CS recommends separate samples from the affected area and nearby normally growing plants, including roots where possible. Sample around the margin of the problem where affected plants are alive. Protect samples from overheating and freezing, and combine nematode testing with checks for other causes of poor growth [10].
Those are examples of laboratory protocols. Agree on the one appropriate to your crop, region, assay, and question, then keep it with the results. A short record of sampling conditions is part of the test’s value.
Find out how the laboratory extracted and counted them
Microscopy-based assessments extract nematodes from soil, count them, and identify a subset closely enough to assign feeding and life-history groups. A Baermann-type method relies on living nematodes moving out of the sample into water. Other methods use physical separation such as sieving or centrifugation [8].
Extraction is part of the measurement. Cesarz and colleagues experimentally varied soil thickness, filters, and sieving in Baermann extraction. Those choices changed recovery and community composition. Retain the extraction protocol when comparing reports across dates or laboratories [8].
Molecular methods answer related questions through DNA. Ask whether the result is an assay for a target organism, calibrated qPCR abundance, or a sequencing profile of the community. Sequencing read proportions reflect recovered DNA and the analytical workflow; interpretation as organism counts requires suitable calibration [4].
Before paying, request a sample report. It should let you find the soil mass or volume analyzed, moisture basis, count or DNA units, extraction method, identification detail, number of individuals identified where applicable, and the index definitions. If your next decision depends on a pest, confirm that the assay detects the relevant species and life stages.
Turn the report into a next step
From a result to a farm decision
Finding
Conditions to check
Useful next step
A plant parasite relevant to the next crop is detected.
Identity, density, life stage, regional risk interpretation, and crop susceptibility.
Plan the crop or variety, rotation, and any treatment with a nematologist or local adviser [11].
Pest numbers persist where resistant soybeans are grown.
Resistance source, egg-density trend, root observations, and other yield constraints.
Discuss an HG type test to assess reproduction on resistance sources [13].
Bacterial feeders or EI rise after an amendment.
Input timing, seasonal conditions, raw counts, and the repeat-sampling window.
Follow the response at the planned window; pair it with nutrient measurements if nitrogen supply is the question [7][15].
SI remains low in comparable samples.
Recovered groups, method consistency, disturbance history, and soil conditions.
Choose a management hypothesis and monitor it with a fair comparison and field outcomes [2][14].
Food-web indices improve and plant feeders increase.
Which plant feeders increased and whether the next crop is a host.
Continue the biological assessment and make a separate crop-pest plan [4][11].
A cover crop is being chosen in an infested field.
The identified pest species, cover-crop cultivar, and locally established host status.
Select a suitable non-host or resistant option with regional advice [12].
Use comparable measurements for monitoring and crop-specific interpretation for pest management.
Cover-crop choice is a particularly useful decision point. NC State’s host-status guidance distinguishes southern root-knot, guava root-knot, and soybean cyst nematodes. A cover crop that interrupts one pest can support another; cultivar differences matter too. Identify the nematode first, then match the crop choice to that organism and the wider rotation [12].
With a biological monitoring result, define the follow-up before buying an amendment or changing a practice. A result suggesting a resource pulse calls for a repeat measurement at a planned interval. A persistent pattern suggesting a simplified food web calls for a closer look at the habitat and a comparison that can test the suspected management cause.
When is the test worth adding
A diagnostic nematode assay earns its place when the result can change a crop, variety, rotation, or pest-management decision. A community assessment earns its place when you need a baseline or comparison for a biological question and have the budget and sampling plan to repeat it.
Write the decision before ordering: “If this pest is present at a locally meaningful density, I will reconsider the next variety,” or “I want to know whether this change in disturbance is accompanied by a repeatable shift in the food web.” Ask who will interpret the result and what follow-up would distinguish the likely explanations.
Keep the profile beside routine fertility results, root observations, aggregate stability or water-entry measurements where relevant, and crop performance. SHE’s guide to tracking soil-health progress provides the broader monitoring framework.
The report becomes valuable when you can name the change, explain how it was measured, and decide what to do next. Nematodes offer a detailed view of the living soil. A good sampling plan connects that view to the field you manage.
Have a nematode report to interpret? Share your crop and location, sampling date and depth, laboratory method, group counts and units, indices, recent management, and the decision you are considering. Those details help SHE’s experts move from a number to a useful answer.
SH
Written by
Soil Health Exchange Editorial
#Nematodes#Soil Biology#Soil Health#Soil Test Interpretation#Soil Sampling#Soil Food Web#Cover Crops
Scholarly record
References & Citation
Source material for every claim in this article, plus a citation-ready record for reference managers and scholarly indexes.
Cite this
Reference this work
SHE-ART-2026-0055
Soil Health Exchange Editorial (2026). Nematodes as Soil Health Indicators: What Can a Test Tell You?. Soil Health Exchange. SHE-ART-2026-0055. https://soilhealthexchange.com/cite/SHE-ART-2026-0055
Soil Health Exchange Editorial (2026). Nematodes as Soil Health Indicators: What Can a Test Tell You?. Soil Health Exchange. https://soilhealthexchange.com/blog/nematodes-soil-health-indicators-testing-interpretation
More citation formats
MLA
Soil Health Exchange Editorial. "Nematodes as Soil Health Indicators: What Can a Test Tell You?." Soil Health Exchange, 2026-10-11, https://soilhealthexchange.com/blog/nematodes-soil-health-indicators-testing-interpretation.
Chicago
Soil Health Exchange Editorial. "Nematodes as Soil Health Indicators: What Can a Test Tell You?." Soil Health Exchange. Published 2026-10-11. https://soilhealthexchange.com/blog/nematodes-soil-health-indicators-testing-interpretation.
Discussion
No comments yet. Be the first to share your thoughts!