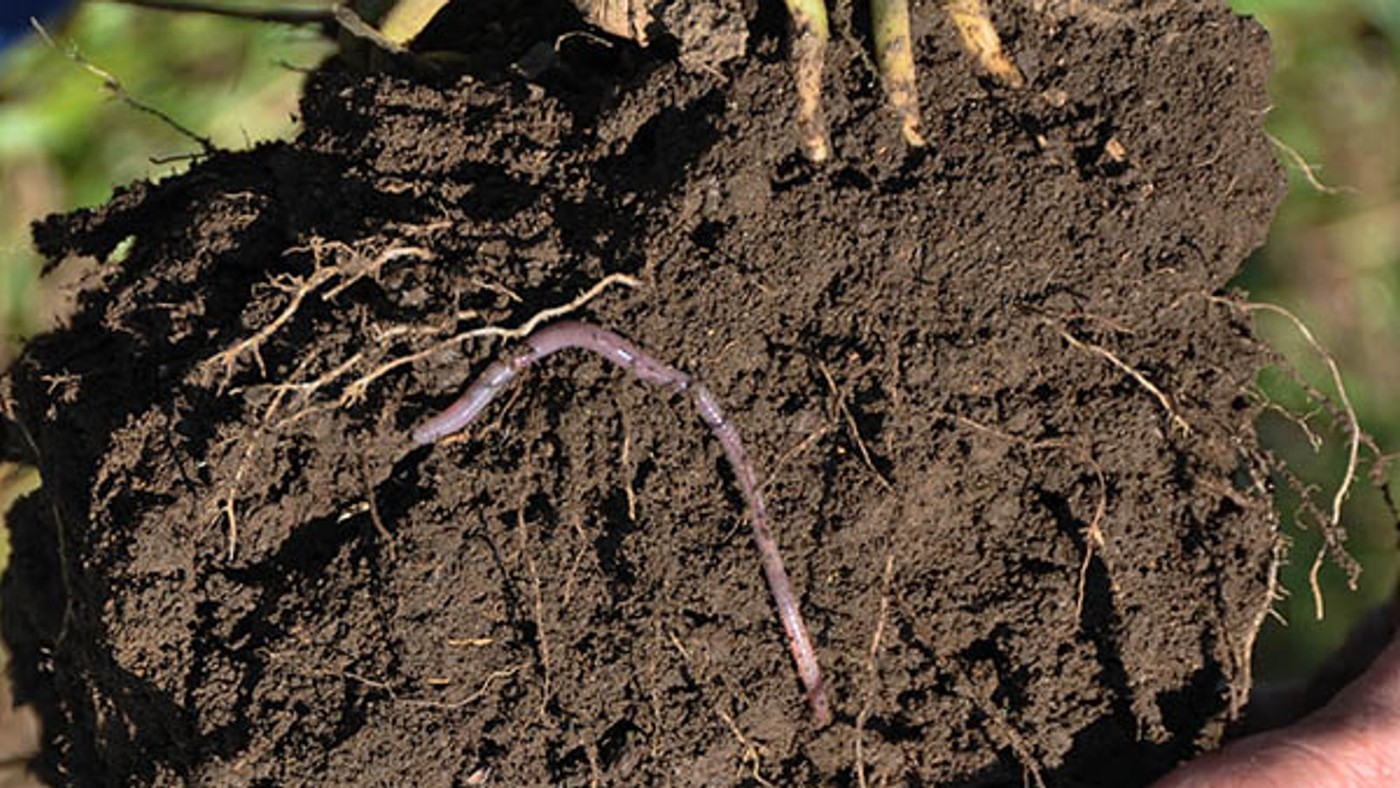
Before a cover crop or tillage change gets credit for building organic matter, price what one more point of it pays. A point of organic matter in the top 6 inches holds a tenth of an inch of extra plant-available water or less and releases roughly 20 lb of nitrogen a year. Counties with more of it also lose less corn in severe drought. At November 2026 prices, nitrogen and drought protection together come to about $6 to $42 per acre per year, but the nitrogen pays only when your fertilizer rate comes down to match. The extra water adds $1.45 to $6 an acre, and only in a dry spell. The harder number is time, because building that point takes a decade in a strong system and far longer in most.
The 20,000-gallon figure meets the soil survey
The figure most farmers have heard is that each 1% of organic matter lets an acre hold 20,000 more gallons of water. It even appears in extension material: a University of Florida publication attributes it to USDA-NRCS, but its reference is a 2015 NRDC blog post rather than a measurement. UF/IFAS publication SS661
Measured soils tell a smaller story, and a USDA team led by Zamir Libohova quantified it with the National Cooperative Soil Survey characterization database. Their abstract reports that each added point of organic matter, across the 0–8% range, can raise available water by about 1.5–1.7% of soil volume, a theoretical value consistent with the database. Over a 15 cm (5.9-inch) acre-furrow slice, the authors put that at 10,800 liters, which is about 2,850 gallons, or a seventh of the popular figure. Libohova et al. 2018, abstract
A global meta-analysis by Minasny and McBratney lands lower still: across 60 published studies and more than 50,000 measurements, each 1% of organic carbon added 1.16 mm of available water per 100 mm of soil. Because 1% carbon is about 1.7% organic matter, one point of organic matter in the top 6 inches works out to about 0.04 inch of water. Both studies found larger gains in sandy soils, and Minasny and McBratney found the smallest gains in clays. Minasny & McBratney 2018, abstract
Water held by one more point of organic matter, top 6 inches
| Estimate | Gallons per acre | Inches of water | Peak-season corn use it covers |
|---|---|---|---|
| Popular figure | 20,000 | 0.74 | about 2 days |
| Libohova et al. 2018 | 2,850 | 0.10 | about 7 hours |
| Minasny & McBratney 2018 | 1,100 | 0.04 | about 3 hours |
Gallons at 27,154 per acre-inch (UGA Extension). Peak corn use of 0.35 inch per day from K-State MF3066, p. 10.
Price that water in a dry spell
Water has a price only when the crop runs short, so value the extra storage in a dry spell. The University of Nebraska benchmark for well-managed corn is about 7.8 bushels for each inch of water supply beyond the first 4 inches. K-State's figure is higher, at 728 lb or 13 bushels per inch of water use once the crop has used its first 11 inches. In this example, the 0.04 to 0.10 inch from one point of organic matter grows 0.3 to 1.3 bushels. At USDA's projected 2026 season-average price of $4.60/bu, that is about $1.45 to $6 an acre each time the profile refills and the crop draws it down in a dry stretch. UNL EC105, p. 4; K-State MF3066, p. 22; USDA WASDE, November 2026, p. 12
Nitrogen is the largest line, and you have to claim it
Organic matter is also a slow-release nitrogen account. The UMass vegetable guide counts about 1,000 lb of N in each point of organic matter in the top 6 inches, of which 2–4%, or 20 to 40 lb, becomes available in most soils each year. University of Minnesota Extension estimates about 20 lb, while UMass suggests 10 lb as a conservative figure because release rises and falls through the season with temperature, moisture and aeration and stalls in waterlogged soil. In the week ending November 13, 2026, Illinois distributor prices put nitrogen at about $0.60 a pound as anhydrous ammonia and $0.84 as urea or 28% UAN. At 20 lb, one point therefore supplies $12 to $17 of nitrogen a year. UMN Extension; UMass New England Vegetable Management Guide; USDA AMS Illinois Production Cost Report
In much of the Corn Belt, however, the recommendation will not lower your rate for that nitrogen, because seven states set corn N rates with the Maximum Return to Nitrogen (MRTN) approach, which averages net returns across regional N-rate trials. As its developers explain, zero-N plots never yield zero because mineralized residue and organic matter, among other sources, feed the crop. The region's average soil N supply is therefore already built into the rate, so a field one point above its neighbors gets the same MRTN number unless the change moves it into a different soil group. Minnesota, for example, uses a separate guideline for non-irrigated loamy fine sands below 3% organic matter. Nafziger et al. 2022, Crops & Soils; UMN Extension, Fertilizing corn in Minnesota
Kansas takes the other route: K-State's guidelines subtract 20 lb of N per acre for each 1% of organic matter in the surface 6 inches for corn and grain sorghum, and 10 lb for wheat. In an MRTN state, the nitrogen line is worth nothing until the field itself justifies a lower rate, through a reduced-rate strip or a presidedress nitrate test credit like the one Wisconsin subtracts from its MRTN rate. K-State MF2586, p. 2; Nafziger et al. 2022
Drought years carry the headline number
The biggest figure comes from Kane and colleagues, who matched soil survey organic matter (0–30 cm, about 0–12 inches) with corn yields and crop insurance records for 754 rain-fed counties from 2000 to 2016. In the very severe drought class, the driest in the study, the authors report that each 1% of organic matter went with 2.2 Mg/ha more corn, about 35 bu/ac, and a 36% smaller share of insurance liability paid out. Kane et al. 2021, Environmental Research Letters
That headline mixes better land with drought protection, because higher-organic-matter counties also out-yield others in normal years, by about 0.7 Mg/ha (roughly 12 bu/ac) per 1% in the authors' normal-year model. Against each county's own yield trend, which strips out the better-land effect, each 1% was associated with an extra 12% of expected yield in very severe drought and 5% in severe drought, the authors report. Moderate drought showed no significant difference.
How often those droughts arrive sets the annual value, so the table weights each drought year by its share of the study's 12,376 county-years. Suppose your trend yield matches the 2026 U.S. forecast of 179.6 bu/ac and corn sells for $4.60.
Drought-year value of one more point of organic matter, worked example
| Drought class | Share of county-years | Extra yield kept | Value that year | Average per year |
|---|---|---|---|---|
| Very severe | 3.3% (410) | 21.6 bu/ac | $99/ac | $3.30/ac |
| Severe | 12.4% (1,537) | 9.0 bu/ac | $41/ac | $5.10/ac |
| Both classes | 15.7% | $8.40/ac |
Yield protection and frequencies from Kane et al. 2021; yield and price from USDA WASDE, November 2026.
The authors caution that a county-scale pattern cannot be assumed to hold when a field gains organic matter through cover crops or reduced tillage, partly because those practices usually move organic matter less than the range between counties. The drought line therefore runs from $0, if the pattern does not carry to your field, to about $8.40 if it does. Their path analysis also traced part of the effect to water-holding and cation exchange capacity, so this line already contains some of the water value above.
One point, priced per acre per year
The annual total counts nitrogen and drought protection and keeps water as a separate dry-spell line.
What one more point of organic matter is worth per acre per year
| Line | Low | High | What sets the range | Sources |
|---|---|---|---|---|
| Water, per dry spell | $1.45 | $6.00 | 0.04–0.10 inch at 7.8–13 bu per inch; $0 when rain is timely | Libohova; Minasny & McBratney; UNL; K-State |
| Nitrogen | $6.00 | $33.50 | 10–40 lb N; $0 on an MRTN rate until a strip or nitrate test justifies a lower rate | UMN; UMass; USDA AMS; K-State |
| Drought-year protection | $0 | $8.40 | County association; whether it holds on your field | Kane et al. 2021 |
| Total per year | $6 | $42 | Nitrogen and drought only; water is valued per dry spell, and the drought line already includes part of it |
November 2026 prices: corn $4.60/bu (USDA WASDE); N $0.60–$0.84/lb (USDA AMS, Illinois).
The value also shifts with the soil. Oldfield and colleagues' global meta-analysis found maize and wheat yields climbing with soil organic carbon and leveling off near 2% carbon (about 3.4% organic matter), a level that two-thirds of the world's maize and wheat land has yet to reach. Put together with the texture results above, a point is worth most on coarse, rain-fed soils that start low and least on a clay already rich in organic matter. Oldfield et al. 2019, SOIL
The slow part: 20,000 pounds for every point
The value builds only as fast as the organic matter does, and this is where the economics turns. An acre of soil 6 inches deep weighs about 2 million lb, so one point is 20,000 lb of organic matter, or about 11,600 lb of carbon. Only 10–20% of plant residue ends up as soil organic matter, so even a well-managed system gains about 0.1 point a year in UMass Extension's estimate. UMass Extension, Building Organic Matter
Even that pace asks a lot of the crop. Writing for the Washington Soil Health Initiative, agronomist Andy McGuire took a best case: a cool northern climate, no-till, and a clay-rich soil starting at 1% organic matter. In that setting, gaining 0.1 point in a year takes about 6.7 tons of aboveground biomass per acre, roughly the residue of a 239-bushel corn crop. McGuire 2023, Washington Soil Health Initiative
Measured gains are usually slower. Across 77 U.S. comparisons, Blanco-Canqui found that cover crops increased soil carbon in only 22, which gained an average of 0.41 Mg C/ha (about 370 lb/ac) a year in the top 30 cm (about 12 inches). Even if every pound landed in the top 6 inches, that pace needs about 30 years to add one point, and the 0.12 Mg/ha (about 110 lb/ac) average across all 77 comparisons needs about a century. Gains were largest on low-carbon soils and after five years of covers, and they did not appear where the cover grew less than 2 Mg/ha (about 1,800 lb/ac) of biomass. Blanco-Canqui 2022, abstract
Strong systems beat that average, and SARE's cover crop bulletin profiles one. Justin Zahradka of Walsh County, North Dakota, grazes cover crop mixes after wheat, and his soil tests show organic matter rising about 0.1 point a year. SARE Cover Crop Economics, p. 10
At 0.1 point a year, the first year earns a tenth of the table, $0.60 to $4.20 an acre, and the full value arrives around year ten. Organic matter rarely pays for a practice in its early seasons, so grazing, herbicide savings and cost-share have to carry those years in the cover crop case study. What the point adds is a return that keeps building after the practice has paid for itself, and on rented ground that return stays with the land.
From a soil test to a claim on carbon
An increase in organic matter on a lab report can inform a grower’s next nitrogen decision. A food company considering a carbon claim for its grain needs to know the change in soil organic carbon stock over a stated depth, area and period. Converting that change into a climate claim also takes a baseline, an estimate of uncertainty and a check on the emissions that changed elsewhere in the system.
Recording who holds a carbon claim matters when the same grain moves from farmer to processor to brand.
Measure it so you can bank it
To bank any of this, the soil test has to track the point. University of Missouri Extension gives 0–6 inches as the standard depth for soil carbon, the same layer Kansas uses for its nitrogen credit. Organic matter moves slowly, and the common loss-on-ignition test struggles to detect small changes. The UK's Agriculture and Horticulture Development Board finds that trends usually show in samples taken every 3–5 years over a decade or more, collected the same way and at the same point in the rotation. MU Extension G9071; AHDB, Monitoring changes in soil organic matter
A carbon program that wants stocks rather than a trend also needs bulk density and the second depth the Soil Health Institute recommends, 15–30 cm (6–12 inches). Morgan & Ackerson 2022, Crops & Soils
The simplest start uses samples you would pull anyway: this fall's 0–6 inch cores from GPS points you can return to, with the lab method and the following crop noted. Kept in My Farm, those results let the test three to five years from now compare like with like. On an MRTN rate, a reduced-N strip next season is the quickest way to learn whether the nitrogen line can start paying you. When a practice is meant to build the point, the Cover Crop Lab can help you pick a mix that makes real biomass.
Funding the years between samples
CSP can support conservation enhancements that keep roots growing longer or improve an established rotation. The Soil and Water Outcomes Fund works with eligible growers who adopt or expand practices that generate climate or water-quality outcomes. Ask what practice change qualifies, how the outcome is estimated and who pays for any repeat sampling. Local soil-health funding can help identify who will support the practice between sampling rounds.
One soil core can start a carbon record. It cannot tell a grower how much a crop held its yield in drought or how much sediment stayed out of a stream. Each of those benefits needs its own comparison, in its own units. With TerraValue, we want to make room for all three and show the farmer which returns are already theirs, which need more evidence and which have a willing buyer.
Discussion
No comments yet. Be the first to share your thoughts!