Part 5 · Understanding & Interpreting Soil Health Indicators
Research Brief
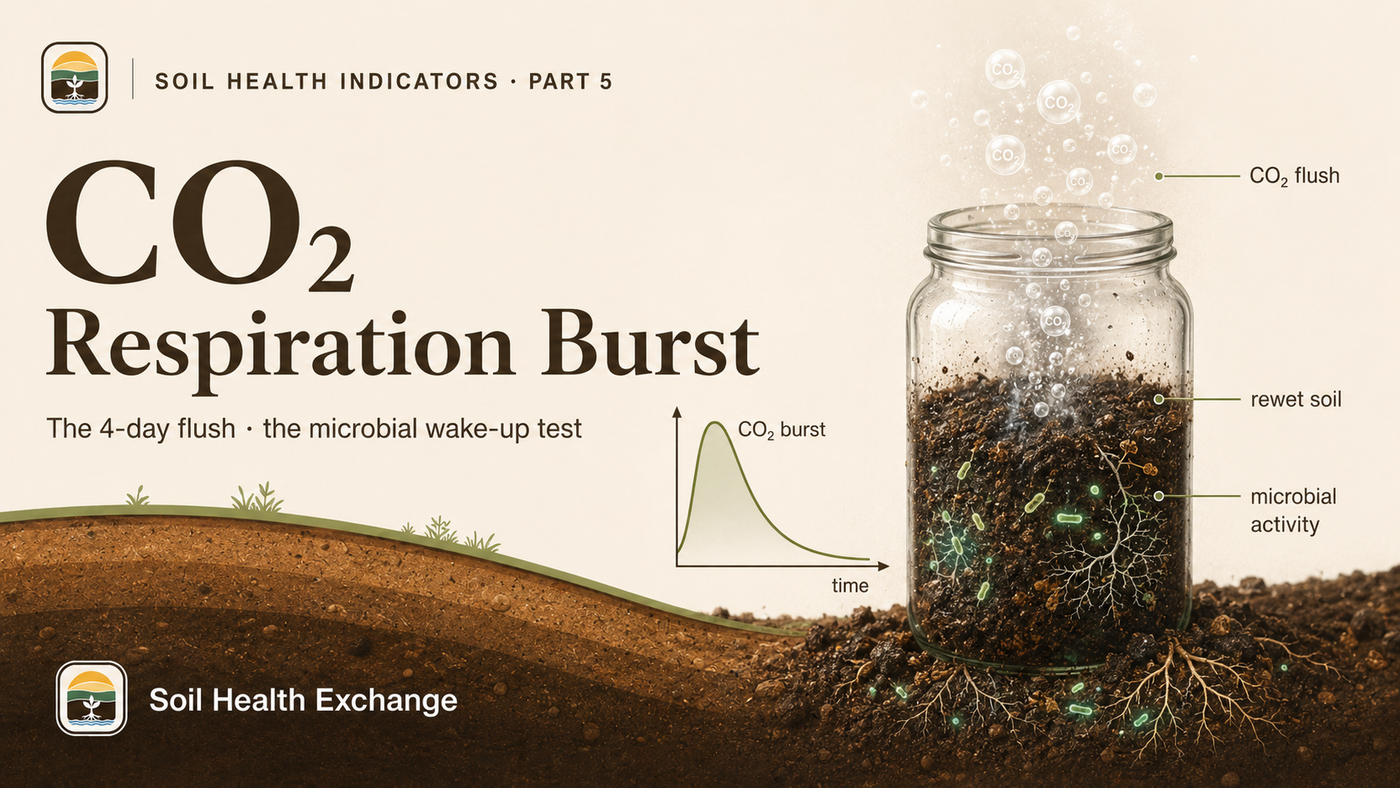
What the 4-Day CO2 Burst Actually Tells You (and What It Doesn't)
Part 5 of our soil health indicator series: how the CO2 burst test (Solvita, Haney, Cornell CASH) measures the living, active fraction of your soil's carbon, how to read the number against texture-specific research benchmarks and producer-facing CO2-C bands, which management practices actually move it, and why the same soil can give very different answers depending on which lab and method you use.
Bottom line up front
The CO2 burst measures the pulse of carbon dioxide your soil's microbes release when a dried, sieved sample is rewetted and incubated (24 hours to 4 days). The short, initial flush is more tightly tied to the active, microbial-biomass-linked carbon pool than to the larger, stable organic-matter pool [1], so it is a fast, biologically meaningful index of how active and well-fed your microbial community is. It tracks organic matter and lab-measured carbon mineralization well [1][2][4] and it responds to management within a few years [11]. But there is no single standard protocol, results can vary 2- to 20-fold between labs [5], texture strongly controls the number [6], and respiration alone can mislead on plant-available N [8] — so read it against a texture-matched, method-matched range [6][12], sample under comparable conditions over time, and pair it with a nitrate test.
What it actually measures
When a soil dries out and is then rewetted, its microbes wake up fast and consume a flush of readily available carbon. The CO2 burst test captures that pulse in a jar. You take an air-dried, sieved soil, rewet it, seal it, and measure the carbon dioxide that evolves over a short incubation. Higher CO2 means a larger, more active microbial community feeding on a bigger pool of easily decomposable carbon [3][3]. It is worth noting that drying and rewetting is itself a disturbance: it lyses some cells and mobilizes labile substrates, so the flush reflects both standing microbial biomass and that rewetting artifact rather than a clean biomass measurement [1][1].
The key insight from the foundational work is *which pool* that CO2 comes from. Across the soils tested under standardized laboratory conditions, the flush of CO2 was tightly tied to the active organic pools — microbial biomass and mineralizable C and N — more tightly than to the bulk, more stable organic carbon that makes up most of soil organic matter [1][1]. In other words, you are not measuring total organic matter — you are measuring the small, living, active fraction that drives much of nutrient cycling, especially nitrogen [3][3].
That is why the test is such a useful early-warning gauge. The active pool turns over fast, so it shifts in response to management years before total soil organic carbon moves measurably. In Franzluebbers et al. 2000, under controlled laboratory incubation, the flush of CO2 explained roughly 97% of the variability in cumulative carbon mineralization, about 86% of soil microbial biomass, and about 67% of net nitrogen mineralization across the soils tested [1][1]. These are correlations with laboratory-incubated mineralization, not with field plant-available nitrogen — a distinction that matters, as the limitations section below makes clear (the grass-sod case). Within that lab scope, a single quick assay stands in for a much more laborious set of biological measurements.
How the lab does it (and why three labs give three answers)
The recipe is conceptually identical everywhere — dry, sieve, rewet, incubate, capture CO2 — but the details differ enough that the absolute numbers are not interchangeable between methods [3][3]. There are three dominant protocols in North American agriculture:
- Haney / Solvita 24-hour: In the foundational Haney et al. 2008 comparison, soil was dried at 40°C, ground to pass a 2 mm sieve, and a 40 g sample wetted to 50% water-filled pore space in a beaker; the Solvita arm read a gel paddle after 1 day at 25°C, and a parallel arm captured CO2 in a 1 M KOH alkali trap read by titration [2][2]. The operational Haney Soil Health Tool that producers order today wets a weighed sample and reads a Solvita gel paddle in a digital reader, reporting mg CO2-C per kg (ppm) [9][9][10][10].
- Franzluebbers 3-day flush: dried soil rewetted to roughly 50% water-filled pore space, incubated at 25°C, with the CO2 captured in an alkali (KOH) trap [1][1].
- Cornell CASH 4-day: 20.00 g of air-dried soil sieved to 8 mm, rewetted by capillary draw from below, sealed with a 0.5 M KOH trap, and incubated 4 days at room temperature; CO2 is quantified from the drop in trap electrical conductivity and blank-corrected [3][3]. Bottom-up capillary rewetting was shown to compare satisfactorily with wetting to a predetermined moisture content [3][3].
CO2 capture itself comes in three flavors — Solvita gel colorimetry, an alkali trap read by titration or conductivity, and infrared gas analysis (IRGA). These read the same soil consistently: in Haney et al. 2008, the day-1 alkali-titration trap (1 M KOH) was highly related to the day-1 Solvita gel reading on the same 50%-water-filled-pore-space soil, for 24-hour CO2 respiration (r² = 0.84, Fig. 7) [2][2], and Solvita's own validation reports a virtually 1:1 relationship to IRGA over roughly 0–125 mg/kg CO2-C, with the gel chemistry itself linear to standardized CO2 over a separate, wider window of about 0–140 ppm (translated from a 0–3% gas-phase range) [7][7]. Two further wrinkles make cross-method comparison invalid. First, the clocks differ: a 4-day cumulative value is structurally larger than a 24-hour value for the same soil, so they are not the same measurement read on a different timer. Second, the units differ in species: Cornell reports CO2 mass (mg CO2 per g soil) while Solvita and Haney report carbon mass (mg CO2-C per kg) — to convert, multiply CO2 mass by 12/44 (≈ 0.273) to get CO2-C, or multiply CO2-C by 44/12 (≈ 3.67) to get CO2 mass. Never compare a number from one method against a threshold built for another.
How to read the number
Because incubation length, soil mass, and reporting units differ by method, interpretation has to be method-specific — and, increasingly, texture-specific. The first table gives published research reference points from the Cornell New York dataset and the Solvita calibration; the second translates the producer-facing Haney/Solvita CO2-C numbers most farmers actually receive into qualitative bands. Methods are not directly comparable across rows or tables; use the one that matches your lab report.
Research reference points by method and context
| Context | Mean (SD) / range | n | Unit | Source |
|---|---|---|---|---|
| Cornell CASH 4-day, statewide (all textures) | 0.60 (0.29) | 1,750 | mg CO2 g⁻¹ (cumulative 4-day) | [6] |
| Cornell CASH 4-day, coarse-textured group | 0.48 | — | mg CO2 g⁻¹ (cumulative 4-day) | [6] |
| Cornell CASH 4-day, loam group | 0.59 | — | mg CO2 g⁻¹ (cumulative 4-day) | [6] |
| Cornell CASH 4-day, silt loam group | 0.69 | — | mg CO2 g⁻¹ (cumulative 4-day) | [6] |
| Cornell CASH 4-day, fine-textured group | 0.67 | 46 | mg CO2 g⁻¹ (cumulative 4-day) | [6] |
| Solvita vs IRGA near-1:1 calibrated range | 0–125 (range) | — | mg/kg CO2-C | [7] |
| Solvita gel linearity to standardized CO2 | 0–140 (range) | — | ppm CO2-C | [7] |
Cornell values are cumulative 4-day respiration as mg CO2 g⁻¹ soil, from Amsili et al. 2021 Table 4 (texture-group means) [6]; the Solvita rows are calibration ranges vs IRGA and gel linearity in mg/kg (ppm) CO2-C from Solvita/Woods End [7]. Methods are not directly comparable across rows (CO2 mass vs CO2-C mass; 24-h vs 4-day). The fine-textured mean rests on a much smaller sample (n=46) than the statewide figure (n=1,750); per-group sample sizes for the coarse, loam, and silt-loam rows could not be verified against the paper and are left blank.
Anchor your reading on texture. In the Cornell dataset, fine and silt-loam soils sat meaningfully above the coarse-textured group mean, which is why a single universal threshold misleads and texture-specific scoring is recommended [6][6]. A 0.48 reading would be about average on a coarse soil but below par on a silt loam. Weigh the fine-textured benchmark cautiously — it rests on only 46 samples versus 1,750 statewide [6][6].
For the Haney/Solvita 24-hour test specifically, most producers receive a single CO2-C number in ppm. Ward Laboratories' Haney interpretation guide places that number on the qualitative scale below. Treat the bands as orientation, not gospel: the guide itself stresses that the rankings are on a sliding scale and are dependent on soil type and climate region (a value of 50 means something different in arid New Mexico than in central Iowa), that readings can fall anywhere from near zero to 1,000 ppm, and that most agricultural soils — described as currently degraded — do not read above 200 ppm [12][12].
Producer-facing Haney/Solvita 24-hour CO2-C interpretation bands
| CO2-C (ppm) | Qualitative band |
|---|---|
| 0-10 | Very Low |
| 11-20 | Low |
| 21-30 | Below Average |
| 31-50 | Slightly Below Average |
| 51-70 | Slightly Above Average |
| 71-100 | Above Average |
| 101-200 | High |
| >201 | Very High |
Soil Respiration Ranking Table from Ward Laboratories' Haney Test Interpretation Guide v1.0, in ppm CO2-C from a 24-hour rewet incubation [12]. The guide explicitly notes these rankings are on a sliding scale dependent on soil type and climate region and should not be applied uniformly across climates; pair with a nitrate test before making N decisions. Not comparable to the Cornell 4-day mg CO2 g⁻¹ values in the table above.
Two CO2-C thresholds worth knowing
Below 20 mg/kg (ppm) CO2-C, Solvita/Woods End state that values are "not recognized as useful for PMN predictions" — they fall outside the calibrated range for predicting potentially mineralizable nitrogen [13]. At the other end, Solvita cites a ~90 ppm CO2-C cutoff "separating N-response from no N-response" — but that cutoff was derived from a single University of Connecticut turf-farm trial applying composted turkey manure to turf plots, so treat it as illustrative, not a validated cropland N threshold [14]. Both are method-specific to the 24-hour Solvita/Haney CO2-C reading and, like the bands above, are climate- and soil-dependent — use them to frame a conversation, not to replace a nitrate test [8].
What management actually moves it
The reason agronomists care about this test is that it responds to the practices producers control, and it does so fairly quickly. The big levers are reducing disturbance, returning carbon, and diversifying the rotation. No-tillage consistently elevated the flush of CO2 in surface soil (0-10 cm), and animal manure application consistently raised it as well [11][11]. Conversely, intensive tillage and simple annual-grain rotations depress it: annual-grain row-crop systems showed significantly lower respiration than diversified or perennial systems [6][6].
Franzluebbers' multi-state survey work points to the same two practices as the most reliable elevators of the burst: it identifies no tillage and routine application of animal manures as the two consistent management approaches that lifted soil-test biological activity in the surface 10 cm, and the highest flush values came from fields that combined no-till with diverse rotations, cover crops, and routine manure inputs [11][11]. The picture is additive: tillage reduction and carbon return reinforce each other rather than competing. Cornell's on-farm CASH work adds a useful nuance about *which* lever matters most for this particular indicator — for the respiration measurement specifically, the primary gains came from moving off the plow to strip-till, with comparatively smaller benefit from cover cropping (whereas cover cropping and reduced tillage contribute roughly equally to indicators like aggregate stability and active carbon); this relative-magnitude framing is the source's narrative description rather than transcribed tabular values [17][17].
Cover crops are nonetheless a real driver, and the cleanest effect size comes from how they feed the labile pool the burst reads. In a 122-study meta-analysis, adding crops to a monoculture rotation raised total soil carbon by 3.6% and total nitrogen by 5.3%, but when the rotation *included a cover crop* total carbon rose 8.5% and total nitrogen 12.8% — the cover-crop subset roughly doubled the carbon gain [15][15]. Separately, rotational diversity substantially increased the fast-cycling pools that drive the rewetting flush: microbial biomass carbon rose 20.7% and microbial biomass nitrogen 26.1%, an effect the authors found was not moderated by crop type or management practice [15][15]. There is an apparent tension with the Cornell finding above: cover crops build the active carbon *pool* (what the burst should read over the long run), but in Cornell's on-farm data tillage reduction moved the respiration *number* faster — so for short-term burst gains, prioritize getting off the plow, and treat cover cropping as the slower-acting pool-builder [15][15][17][17]. Manure and compost amendments tend to increase the burst with loading; the assay is sensitive to such inputs, consistent with the Solvita gel system's calibration history on compost and manure-amended materials [7][7].
Don't confuse carbon gains with field CO2 emissions
The lab burst measures the *capacity* of your soil's microbes to mineralize labile carbon when rewetted — a proxy for the active carbon pool that cover crops build. That is a different thing from CO2 venting off your field. Nebraska on-farm chamber data report two related but distinct findings: cover-crop biomass above ~2.23 t/ac may increase springtime field CO2 flux (while 0.10-2.23 t/ac may not affect it), and separately, late-terminated cover crops produced spring field CO2 emission roughly 2x that of early-terminated or no-cover treatments — attributed largely to living-plant and root respiration, not the microbial mineralization the lab assay isolates. After three seasons there was no significant change in measured soil organic carbon [16]. A high field CO2 reading from standing cover-crop biomass is not the same signal as a high lab burst, and neither one by itself proves carbon is being sequestered.
The chart below shows mean respiration by cropping system on coarse-textured soils from the Cornell New York dataset (Amsili et al. 2021, Table 7), where cropping system explained only about 11.7% of respiration variance — meaning the great majority is driven by texture, site, and sampling [6][6]. The differences between systems are real and directional but small, and they are not a clean monotonic gradient: pasture, a low-disturbance perennial system, sits between the vegetable and dairy-crop systems on these coarse soils. Note that this ordering is specific to coarse-textured soils; in the same dataset, pasture tends to have the highest respiration of any system on finer-textured (loam, silt-loam, and fine) soils, so the coarse-panel mid-pack position of pasture is not the general pattern [6][6].
4-day CO2 respiration by cropping system (coarse-textured NY soils)
Mean 4-day CO2 respiration on coarse-textured soils, by cropping system, from Amsili et al. 2021 Table 7 (Coarse-Textured panel) [6]. Cropping system explained only ~11.7% of respiration variance, so these means carry large within-group spread; the management effect is real but small relative to texture and between-lab variability, and the ordering shown is specific to coarse soils.
Because direct burst-value comparisons for cover-crop versus no-cover or no-till versus conventional plots are scarce in the published literature, the cleanest available magnitudes come from the carbon pools the burst tracks rather than from head-to-head burst tables. The chart below makes that link concrete: across the 122-study meta-analysis, the gains in total carbon (a cover-crop contrast) and microbial-biomass carbon (a rotational-diversity contrast) index the active fraction the rewetting flush quantifies [15][15].
Carbon-pool gains from rotational diversity and cover crops (122-study meta-analysis)
Percent increase from McDaniel et al. 2014, a meta-analysis of 122 studies [15]. The two total-C bars are a cover-crop contrast: total soil C rose 3.6% by adding crops to a monoculture but 8.5% when the rotation included a cover crop. The microbial-biomass-C bar is a different, rotational-diversity contrast (not cover-crop-specific): MBC — the fast-cycling pool that drives the CO2 burst — rose 20.7% with rotational diversity, an effect not moderated by crop type or management. These are total/microbial-biomass C gains, not direct CO2-burst values, but they index the active pool the burst measures.
Read directionally, the pattern holds: less disturbance plus more and more-diverse carbon inputs tend to feed a bigger active microbial pool [6][6][11][11][15][15]. But the spread within each system is wide and only a small share of the variation is explained by cropping system, so treat these as soft tendencies, not rankings — and if you are tracking your own ground over time, this is nonetheless the indicator most likely to respond to a new cover-crop, reduced-till, or manure program before total organic carbon budges.
How to sample for a valid reading
Because the test rewets a dried soil, the number is sensitive to how and when you sample. Pull from the surface zone the benchmarks were built on (roughly 0-10 cm for the Franzluebbers flush; follow your lab's depth for Haney/Cornell), and keep that depth identical year over year. Sample at the same time of season and under comparable moisture. Because measured mineralizable C is sensitive to rewetting method and antecedent conditions [5], avoid sampling shortly after fresh residue incorporation, a manure application, or heavy rain, any of which can shift the result independent of underlying soil health. Composite multiple cores per management zone to average out small-scale variability, and send repeat samples to the same lab using the same method so your trend is apples-to-apples.
What it cannot tell you
This is a genuinely useful test, but it has hard limits — and most of them come from the same procedural looseness that makes it cheap and fast.
- No standard protocol, large between-lab variability. Mineralizable C / CO2 burst showed 2-fold to 20-fold greater inter-laboratory variability than other common soil tests [5][5]. The same sample sent to two labs can return very different numbers — and the authors of that study argue this variability compromises the indicator's usefulness, not merely its precision [5][5].
- Procedure changes the answer. Sieve size and the rewetting method (capillary vs top-watering vs wetting to a target moisture) significantly change measured mineralizable C [5][5], and the soil mass and volume used in the assay also shift the estimate [11][11].
- Methods are not comparable. With incubations of 24 h, 3 d, and 4 d in common use — and CO2 versus CO2-C reporting — absolute values cannot be compared across methods [3][3].
- Sampling timing and field conditions matter. Because the test rewets a dried soil, the result is sensitive to antecedent field moisture, sampling season, and rewetting procedure [5][5]. A field sampled after a dry spell, or shortly after residue incorporation, can give a very different burst independent of its underlying soil health.
- Lab burst is not field CO2 flux. The assay isolates microbial mineralization of a dried-rewetted sample; it does not measure what your field is venting (see the cover-crop warning above) [16][16].
- It can mis-predict available nitrogen. A soil can show high microbial respiration but low plant-available N — grass sod is the classic example — so respiration alone is a contested predictor of available N and should be interpreted alongside a nitrate test [8][8]. Even within the Solvita/Haney framework, CO2-C below 20 mg/kg is treated as outside the useful range for N prediction [13][13].
- Haney-specific caution. The Haney Soil Health Tool uses non-standard H3A extracts, so its outputs require separate calibration and caution before driving nutrient recommendations [9][9][10][10].
- Interpretive bands are region-dependent. Even published producer-facing CO2-C ranges warn that the same number means different things across climates and soil types [12][12], reinforcing that texture-specific, locally-calibrated scoring beats one universal threshold [6][6].
Use it as a trend, not a verdict
Because of the between-lab and procedural variability — which the researchers who documented it argue compromises the indicator's usefulness, not just its precision [5] — the most defensible use of the CO2 burst is as a relative, within-field, same-lab, same-method trend over time, not as a single absolute number compared against a neighbor's soil run at a different lab. For nutrient decisions, never let respiration stand alone: pair it with a nitrate test [8], respect the documented CO2-C thresholds for N prediction [13][14], and treat Haney-tool nutrient outputs as needing local calibration [9][10].
The bottom line
The CO2 burst is one of the most studied biological soil health indicators available to producers. Bagnall et al. 2023 selected 24-hour carbon mineralization potential — alongside soil organic carbon concentration and aggregate stability — as one of just three measurements in a recommended minimum suite of indicators for North American agriculture, on the grounds that it is responsive to management and well correlated with soil organic carbon (the paper reports the suite's indicators correlated to soil organic C at r = 0.56 to 0.91) [4][4]. That this minimum-suite framing coexists with the validity concerns raised by Wade et al. 2018 [5][5] reflects a genuine, unsettled debate in the literature rather than a closed question. Note too that strong SOC correlation cuts both ways: part of the respiration signal is redundant with SOC, and the test's distinct value lies less in revealing something SOC cannot and more in responding to management faster than total carbon does [1][1][2][2].
Use it the way it actually works: read it against a texture-matched, method-matched range [6][6][12][12], track it over time at the same lab and under comparable sampling conditions to watch your management pay off [11][11], and never ask it to do a job — predicting available N on its own — that it was never built to do [8][8][13][13].
Test Your Knowledge
Each attempt draws 8 questions from a 12-question pool and shuffles both the questions and answer choices. Score 85% or higher to earn a Certificate of Completion.
1.What does the short CO2-burst test most directly measure?
2.Across the soils tested under standardized laboratory conditions by Franzluebbers et al. (2000), roughly how much variation in cumulative laboratory carbon mineralization was associated with the CO2 flush?
3.Why can you not directly compare a CO2 number from the Cornell CASH test against a Haney/Solvita threshold?
4.How does the inter-laboratory variability of the mineralizable C / CO2 burst compare with other common soil tests?
5.Why can high microbial respiration mislead you about plant-available nitrogen?
6.Which two management approaches does Franzluebbers' multi-state survey identify as the most consistent elevators of the burst in the surface 10 cm?
7.What does the Cornell dataset imply about using one universal CO2-burst threshold?
8.In Bagnall et al. 2023, how was 24-hour carbon mineralization potential treated?
Written by
Soil Health Exchange Team
Scholarly record
References & Citation
Source material for every claim in this article, plus a citation-ready record for reference managers and scholarly indexes.
Cite this
Reference this work
Soil Health Exchange Team (2026). What the 4-Day CO2 Burst Actually Tells You (and What It Doesn't). Soil Health Exchange. SHE-ART-2026-0013. https://soilhealthexchange.com/cite/SHE-ART-2026-0013
Soil Health Exchange assigns a stable identifier to every published answer and article. Citations keep working even if the URL changes later.
Sources (17)Show sources
- 1.Franzluebbers, A.J., Haney, R.L., Honeycutt, C.W., Schomberg, H.H., Hons, F.M. (2000). Flush of Carbon Dioxide Following Rewetting of Dried Soil Relates to Active Organic Pools. Soil Science Society of America Journal 64(2):613-623. (Source returned HTTP 402; the ~97%/~86%/~67% lab-incubation relationships and the 'soils tested' framing remain to be confirmed against the full text.)
- 2.Haney, R.L., Brinton, W.H., Evans, E. (2008). Estimating Soil Carbon, Nitrogen, and Phosphorus Mineralization from Short-Term Carbon Dioxide Respiration. Communications in Soil Science and Plant Analysis 39(17-18):2706-2720. (Confirmed against the open author PDF: titration-vs-Solvita 24-h method agreement r2=0.84, Fig. 7; 1-day Solvita vs initial water-soluble organic N r2=0.91, Fig. 2; soil dried at 40C for 24 h, ground to pass a 2-mm sieve, 40 g wetted to 50% water-filled pore space, incubated at 25C.)
- 3.Schindelbeck, R.R., Moebius-Clune, B.N., Moebius-Clune, D.J., Kurtz, K.S. et al. (2016). Cornell Soil Health Laboratory Comprehensive Assessment of Soil Health SOP - CSH 06 Soil Respiration. Cornell University.
- 4.Bagnall, D.K., Rieke, E.L., Morgan, C.L.S., Liptzin, D.L., Cappellazzi, S.B., Honeycutt, C.W. (2023). A minimum suite of soil health indicators for North American agriculture. Soil Security 10:100084. (Source returned HTTP 403; the three-indicator minimum suite and the reported r=0.56-0.91 indicator-to-SOC correlation range remain to be confirmed against the full text.)
- 5.Wade, J., Culman, S.W., Hurisso, T.T., Miller, R.O., Baker, L., Horwath, W.R. (2018). Sources of Variability that Compromise Mineralizable Carbon as a Soil Health Indicator. Soil Science Society of America Journal 82(1):243-252.
- 6.Amsili, J.P., van Es, H.M., Schindelbeck, R.R. (2021). Cropping system and soil texture shape soil health outcomes and scoring functions. Soil Security 4:100012. (Cornell open-access PDF inaccessible at finalize time, HTTP 401/403; Table 4 texture-group respiration means [statewide 0.60 (0.29), n=1,750; fine 0.67, n=46; coarse 0.48; loam 0.59; silt loam 0.69], Table 7 coarse-textured cropping-system means, and the ~11.7% cropping-system variance figure remain paywall-unverifiable. Per-group n for coarse/loam/silt loam and the fine-group SD could not be confirmed and are omitted.)
- 7.Solvita / Woods End Laboratories. Solvita CO2-Burst Soil Respiration Test - accuracy. (Confirmed verbatim: 'virtually 1:1 relationship over a range of 0-125 mg kg' vs IRGA; gel chemistry linear over 0-3% CO2, 'translating into a linearity of about 0-140 ppm in soil samples'. The compost/manure calibration-history characterization is general background from Solvita/Woods End materials, not a quantified dose-response.)
- 8.Lindsey, L.E. & Culman, S. (2019). Solvita CO2 Respiration Soil Health Test. Ohio State University Extension, Agronomic Crops Network.
- 9.Lindsey, L.E. (2019). The Haney Test for Soil Health. Ohio State University Extension, Agronomic Crops Network.
- 10.Haney, R.L., Haney, E.B., Smith, D.R., Harmel, R.D., White, M.J. (2018). The soil health tool - Theory and initial broad-scale application. Applied Soil Ecology 125:162-168.
- 11.Franzluebbers, A.J. (2020). Soil-test biological activity with the flush of CO2: VIII. Soil type and management diversity. Soil Science Society of America Journal 84(4):1090-1102. (Full text paywalled, HTTP 402. From publisher abstract / search index: 'consistent management approaches that led to elevated soil-test biological activity in the surface 10 cm of soil were no tillage and application of animal manures'; highest values came from fields with no-till, diverse rotations, cover crops, and routine animal manure; assay estimate also varies with soil mass/volume. A previously cited overall-flush mean of ~237 mg CO2-C kg-1 over 0-3 d [middle 50% 67-357] could not be confirmed against the full text and has been removed from the article.)
- 12.Ward Laboratories, Inc. Haney Test Interpretation Guide v1.0 - Soil Respiration Ranking Table. (Confirmed verbatim against the guide PDF: bands 0-10 Very Low, 11-20 Low, 21-30 Below Average, 31-50 Slightly Below Average, 51-70 Slightly Above Average, 71-100 Above Average, 101-200 High, >201 Very High; 'readings can fall anywhere from near zero to 1000 ppm of CO2-C. However, most agricultural soils are currently degraded and do not read above 200 ppm'; rankings 'are on a sliding scale and are somewhat dependent on soil type and climate region'.)
- 13.Solvita / Woods End Laboratories. Potential Mineralizable Nitrogen (PMN) Calculator - CO2-Burst. (Confirmed verbatim: 'Values less than 20 mg/kg in soil for CO2 Burst are not recognized as useful for PMN predictions.')
- 14.Solvita / Woods End Laboratories. Recent Advances in Solvita Science. (Confirmed verbatim: 'The Solvita CO2 test also suggested a cutoff value separating N-response from no N-response at 90ppm CO2-C'; derived from a University of Connecticut turf-farm trial applying composted turkey manure to turf plots.)
- 15.McDaniel, M.D., Tiemann, L.K., Grandy, A.S. (2014). Does agricultural crop diversity enhance soil microbial biomass and organic matter dynamics? A meta-analysis. Ecological Applications 24(3):560-570. (Abstract confirmed verbatim via PubMed: 122 studies; adding crops to monoculture raised total soil C 3.6% and total N 5.3%; with a cover crop in rotation total C +8.5% and total N +12.8%; rotations increased microbial biomass C 20.7% and N 26.1%, effect 'not moderated by crop type or management practices.' The MBC/MBN figures are a rotational-diversity contrast, distinct from the cover-crop total-C contrast. Full Wiley text paywalled, HTTP 402.)
- 16.University of Nebraska-Lincoln CropWatch (2018). Cover Crop and CO2 Emissions. (Confirmed via fetch: cover-crop biomass 0.10-2.23 t/ac may not affect field CO2 emissions while >2.23 t/ac may increase them; late-terminated cover crops produced spring field CO2 emission ~2x that of early-terminated/no-cover treatments, attributed largely to plant respiration; no significant change in SOC concentration after three seasons.)
- 17.Schindelbeck, R.R., et al. (2017). Reduced Tillage and Cover Crops Have Additive Effect for Improving Soil Health. Cornell 'What's Cropping Up?' Blog / Comprehensive Assessment of Soil Health. (Confirmed via fetch: for the soil respiration and available-water-capacity indicators specifically, narrative text states 'primary benefits [come] from transition from plow to strip-till, and less benefits from cover cropping'; reduced tillage and cover cropping give roughly equal additive benefits for aggregate stability, organic matter, soil protein, and active carbon. Exact mg CO2 values are in Table 1, which was not transcribed in the accessible text; the relative-magnitude framing used in the article is qualitative, from the source narrative only.)
Cite this articleShow formats
Cite this article
Citation-ready record
APA
Soil Health Exchange Team (2026). What the 4-Day CO2 Burst Actually Tells You (and What It Doesn't). Soil Health Exchange. https://soilhealthexchange.com/blog/soil-co2-respiration-burst-interpretation
More citation formats
MLA
Soil Health Exchange Team. "What the 4-Day CO2 Burst Actually Tells You (and What It Doesn't)." Soil Health Exchange, 2026-06-15, https://soilhealthexchange.com/blog/soil-co2-respiration-burst-interpretation.
Chicago
Soil Health Exchange Team. "What the 4-Day CO2 Burst Actually Tells You (and What It Doesn't)." Soil Health Exchange. Published 2026-06-15. https://soilhealthexchange.com/blog/soil-co2-respiration-burst-interpretation.
Citation metadata is provided for discovery tools and reference managers. Inclusion in external scholarly indexes is not guaranteed.
Continue reading
All articles →From this series
Understanding & Interpreting Soil Health Indicators

Part 1
PLFA Analysis: What Soil Biology Testing Can and Cannot Tell You
PLFA is the most reproducible method for measuring living microbial biomass in soil — but no validated thresholds exist for interpreting the numbers. Here is what the science actually supports.

Part 2
What an ACE Protein Test Actually Tells You (and What It Doesn't)
The ACE protein test estimates the size of the soil's organically bound nitrogen reservoir.
Part 3
What POX-C (Active Carbon) Actually Tells You About Your Soil
Permanganate-oxidizable carbon (POX-C) is the most popular "active carbon" soil health test for good reason: it's cheap, repeatable, and moves with management faster than total organic carbon. Here's what the number means, how to read it for your soil, what actually shifts it, and the limitations that should keep you from over-interpreting it.
Part 4
What Potentially Mineralizable Nitrogen (PMN) Tells You About Your Soil's Nitrogen Engine — and What It Won't
Part 4 of Understanding & Interpreting Soil Health Indicators: what Potentially Mineralizable Nitrogen (PMN) measures, the first-order mineralization kinetics behind it, how the lab runs the 7-day anaerobic incubation, how PMN compares to PSNT, ISNT, ACE protein, hot-KCl and the CO2 burst, how to sample and handle a fresh-soil-only test, what management moves it, and why it is a useful capacity index but a weak stand-alone fertilizer predictor.

Part 5 · You’re reading this
What the 4-Day CO2 Burst Actually Tells You (and What It Doesn't)
Discussion
No comments yet. Be the first to share your thoughts!