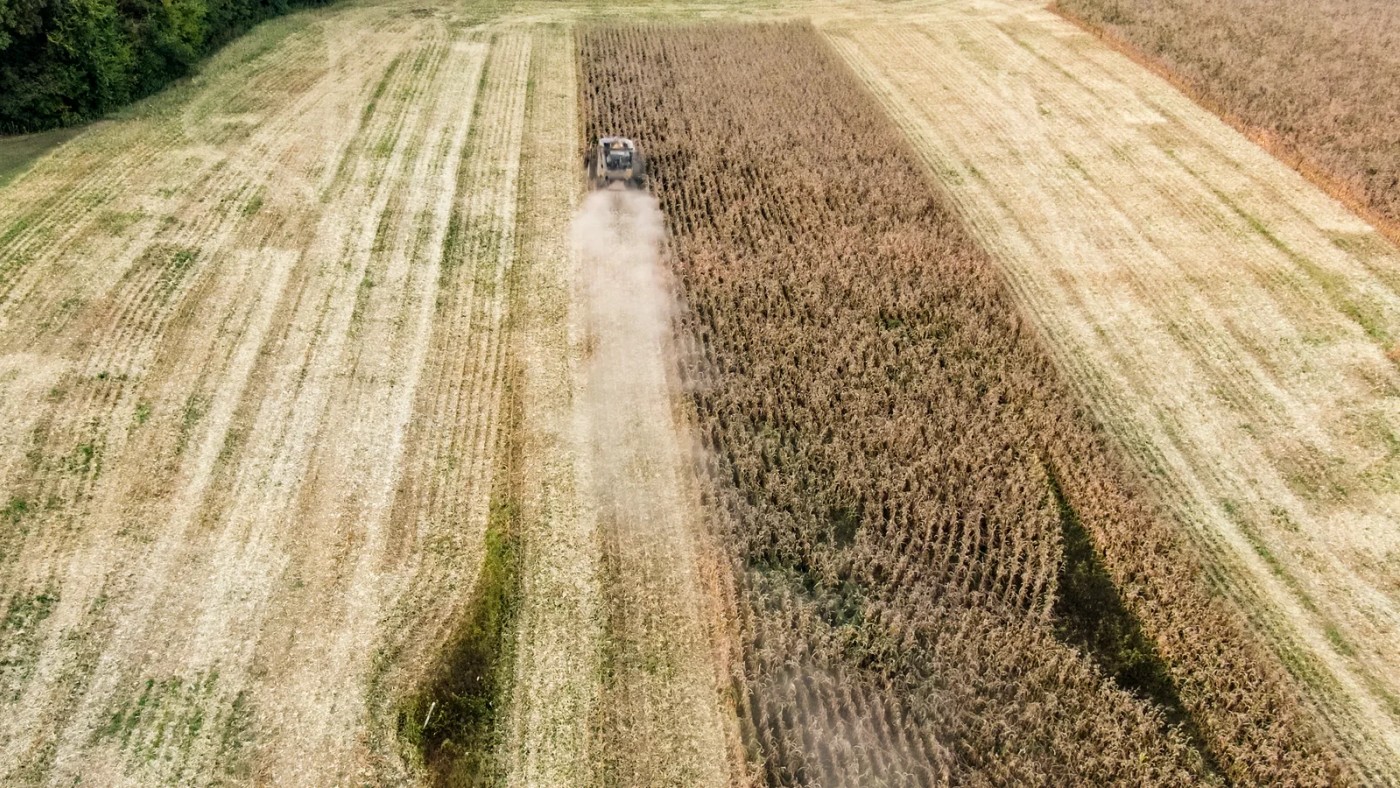
A farm that cuts tillage and plants cover crops is making two investments with very different paybacks. The tillage saving can arrive in the first season, as soon as a pass comes off the schedule, although no-till also carries its largest yield risk in those early years. A cover crop is slower to pay: in SARE's base budget for corn, it loses $31.36 an acre in year one and reaches break-even only in year three. That difference in timing, more than any single average, decides whether a regenerative transition pays on a given farm and how long the dip lasts.
Farmers and their advisers usually want two answers: what happens to net income when the farm moves to no-till, cover crops, longer rotations or grazing, and how many seasons pass before the change pays. No single study answers both, because each measured a different population and outcome, but read side by side they agree on where the money comes from and when it arrives.
A farm can save diesel this spring, take a yield hit at harvest and leave cleaner water downstream. Those changes land on different budgets and different dates. This series starts with the return the grower can actually use, then follows the value that an ordinary farm account leaves out.
What each study measured
What each study measured
| Source | Who was measured | Outcome | Result |
|---|---|---|---|
| USDA ERS, ERR-353 (2025) | National survey fields: corn 2010 and 2016, soybeans 2012 and 2018 | Yield and production cost, raw and matched comparisons | Conservation-tilled corn cost $598.82 vs $625.35; cover-cropped corn cost $745.06 vs $604.47 (54 covered fields); no significant yield difference in either raw comparison |
| Flanders et al. 2026, Soil Health Institute | 100 corn and soybean farmers in nine states, before vs after adoption | Partial-budget net farm income | Reduced tillage: +$53 corn, +$45 soybeans; cover crops: no significant further difference |
| Plastina et al. 2018 | Mailed survey, 233 Iowa cover-crop users; covers in 2015, cash crop in 2016 | One year's partial budget, covered vs uncovered fields | Herbicide-terminated covers without grazing or forage value and cost share: −$48.82 before corn, −$38.42 before soybeans |
| EDF and University of Minnesota partners | Southern Minnesota farm ledgers, 2022–2024; 12 to 16 covered corn fields a year | Net return after labor and management vs regional average | Corn with cover: +$7.77 to +$21.89, with land costs $32 to $78 below the region; soybeans with cover: −$28.06 to −$144.39 |
| Zhang et al. | Three long-term trials in Ohio and Michigan | No-till vs chisel net return, 2024 dollars | Corn: +$34.04 to +$92.50; soybeans: +$30.03 to +$85.72 |
| Davis et al. 2012 | Marsden Farm, Iowa, 2003–2011 | Net return to land and management | 2-, 3- and 4-year rotations not significantly different |
Dollar figures are per acre. Zhang et al. values are summarized from the no-till part of this series.
Among these studies, reduced tillage gives the steadiest result, because its saving comes from passes that disappear. In USDA's national field survey, conservation-tilled corn cost about $27 an acre less to grow, mostly in fuel and labor. Yields did not differ significantly in that raw comparison, and a matched comparison of similar fields linked conservation tillage to higher corn yields. ERS stopped short of a net-return estimate, and its review of long-term trials finds no-till profits not uniformly higher than tillage, with input savings behind the cases where no-till wins. USDA ERS, ERR-353, pp. 19 and 25–26
The farmer budgets fill the net-return gap. The Soil Health Institute interviewed 100 farmers who had moved from conventional tillage to reduced tillage, most of them with cover crops, and compared their budgets before and after the change. Net farm income rose by about $53 an acre for corn and $45 for soybeans, with lower expenses supplying less than half of the gain and higher yields the rest. Three long-term trials in the no-till part of this series point the same way, with no-till ahead of chisel tillage for both crops at every site over roughly three decades. Flanders et al. 2026
Cover crops add cost before they return anything, so their result depends on the job the cover is given. Cover-cropped corn fields in the ERS survey cost about $141 an acre more, a raw gap across 54 fields that ERS says reflects where and how those fields are farmed, not the cover alone. Among the Soil Health Institute's farmers, cover-crop users reported significantly lower fertilizer and pesticide bills but no significant difference in net income from reduced-till farmers without covers. In a mailed survey of 233 Iowa cover-crop users, who averaged 7.9 years with covers, Plastina and colleagues found that a typical year rarely paid: the cover lost money on average unless it was grazed or harvested for forage and the farmer also received cost share. Plastina et al. 2018
In Southern Minnesota farm ledgers, corn with a cover crop finished ahead of the regional average after labor and management in each year from 2022 to 2024, while soybeans with a cover trailed theirs every year. The corn lead rests on 12 to 16 covered fields a year that yielded 15 to 17 bu/ac less than the region and paid $32 to $78 an acre less for land. Charged the regional land cost, the covered corn would have trailed in every year, so the corn lead reflects cheaper land rather than a return from the cover. EDF and University of Minnesota, Table 6
Many operations also do not keep cover crops from one census to the next. Among operations that answered all three censuses, 48% of those reporting covers in 2012 reported them again in 2017, and 46% of the 2017 group did so in 2022. More than half had stopped, for reasons the census does not record. USDA ERS, ERR-353, pp. 9–11
Longer rotations trade inputs for management
At Iowa State's Marsden Farm from 2003 to 2011, three- and four-year rotations that added a small grain, red clover or alfalfa and composted cattle manure earned net returns not significantly different from the corn–soybean rotation. They reached that profit with 80 to 86% less synthetic nitrogen and 88% less herbicide, but they needed more labor and closer management. The returns exclude land costs and federal payments, so they compare cropping systems rather than whole farms. Even so, the trade they show is the one most regenerative transitions make: similar profit, far fewer purchased inputs and more of the farmer's time. Davis et al. 2012
The headline numbers, read for what they measured
Three figures travel farther than the studies behind them, and each describes a particular kind of farm.
"78% more profit" with 29% less corn
LaCanne and Lundgren compared corn fields on 20 farms in Nebraska, North Dakota, South Dakota and Minnesota, grouped by how many practices they combined, such as multispecies covers, no-till, no insecticide and grazing. Regenerative fields produced 29% less grain, about 135 bu/ac against 189 bu/ac, yet earned more profit per acre. The abstract puts that gain at 78% and the paper's profit figure at 70%, so either can turn up in a quote. LaCanne and Lundgren 2018
Profit in that study counted direct costs only, and the difference came from two places. Conventional fields spent 32% of their gross income on seed and fertilizer, against 12% on regenerative fields. The regenerative farms also brought in revenue the conventional fields lacked: grazing, organic premiums on three of the ten farms, and grain sold directly as seed or feed. The figure therefore describes a marketing and livestock system as much as a soil practice, and a commodity corn farm without those revenue streams should not budget for a similar result.
"A 30–60% dip, then up to 120% more"
Boston Consulting Group and the business coalition OP2B built a model rather than collecting farm records. It follows a representative Kansas wheat farm that adds intercropped soybeans, reduced tillage and a local rancher's cattle on its residue, then corn, until it sells three crops every three years instead of two. During a three- to five-year transition, modeled profit falls 30 to 60% or more below the conventional farm. The authors put that loss at $15 to $45 or more an acre each year. After that, profit settles about 70% above conventional, and the advanced system reaches as much as 120% above. BCG and OP2B 2023, pp. 7 and 11–13
Most of that gain comes from selling more crops from the same acres, which depends on moisture for the added crops and a market for them. The model counts no premiums, program payments or yield gains from soil change, and it assumes favorable weather and enough agronomic support to make the switch. The "15–25%" figure is the model's 10-year return on investment, a different measure from a profit gain. BCG and OP2B 2023, pp. 10–13 and 24
"$52 an acre" from established adopters
The $52 figure is the Soil Health Institute's 2021 summary of its 100 farmer interviews: $51.60 an acre for corn and $44.89 for soybeans, at standardized long-term prices and without government payments. The 2026 journal paper reports the same interviews per hectare, which converts to about $53 for corn, and its expense savings match the fact sheet's. These were established adopters looking back. Those using no-till had used it for an average of 19 years and those growing covers for about nine, and net income rose for 85% of the corn growers and 88% of the soybean growers. It is strong evidence that the system pays for farmers who stayed with it. Soil Health Institute 2021
Three questions for any headline number
Before a figure goes into a budget, ask who was measured, which costs and revenues its profit counts, and how many years into the change the farms were.
How long the dip lasts
In SARE's Cover Crop Economics bulletin, the base case for corn charges the survey's median cost for seed and seeding, assumes a spring burndown the farmer makes anyway, and counts fertilizer and weed-control savings that grow as the soil improves. Three conditions change the clock: grazing that replaces hay, a drought year in which covered fields yield more, or a $50 incentive payment each turns the first year positive. Every special situation in SARE's table is positive by year three. SARE, Cover Crop Economics, Table 4
A cover crop on corn, year by year
| Scenario | Year 1 | Year 3 | Year 5 |
|---|---|---|---|
| Base case, normal weather | −$31.36 | +$1.42 | +$17.90 |
| Grazing replaces hay | +$17.87 | +$50.65 | +$67.13 |
| Drought year | +$27.34 | +$77.15 | +$110.45 |
| $50/ac incentive payment | +$18.64 | +$51.42 | +$67.90 |
Net return per acre after one, three and five years of cover cropping. Base case: $37/ac seed and seeding, $3.50 corn, 200 bu/ac, spring 2019 prices; the drought row uses 2012's $6.89 corn and 142 bu/ac. SARE, Cover Crop Economics (2019), Table 4.
SARE's base case takes its yield gains from farmers who answered a national survey, and those gains grow from about half a percent in year one to 3% by year five. Satellite studies of recent adopters across far more fields found average corn yield losses of about 3% to 5.5% instead. At SARE's 200 bushels and $3.50 corn, each point of yield is worth $7 an acre. In this example, swapping the year-five gain for those losses turns the base case's +$17.90 into roughly −$24 to −$42 an acre. A planning budget should carry that loss range beside SARE's survey gains. Lobell et al. 2025 · USDA ERS, ERR-353, p. 20
Iowa survey budgets sit below SARE's curve as well. In Plastina's survey, herbicide-terminated covers ahead of corn lost less as farmers gained experience: about $37 an acre for those with up to three years and $15 for those with ten or more. Even with cost share counted, the result stayed negative without grazing or forage value. Plastina et al. 2018, Table 5
Tillage runs on a different clock. The saved passes pay in the first season, but no-till's yield drag is largest in its first years and narrows over time where residue stays on the field and crops are rotated, as the no-till part shows. For corn, the Soil Health Institute likewise tied the income change to how long a farmer had used the system. A whole-farm redesign like the Kansas model takes longest of all, because new crops, equipment and buyers have to come together before the rotation earns its keep. USDA ERS, ERR-353, p. 19
The dip also lands on a specific person. Cover-crop seed and seeding bills arrive when the cover is planted, a cost-share payment arrives on the program's schedule, and grazing value belongs to whoever owns the cattle. On rented ground, the tenant who pays for the transition may not farm the field long enough to collect, while a long-term soil gain stays with the land and its owner.
Who benefits when a field changes?
A cover crop can earn its keep twice in different places. The grower may buy less feed. Downstream, a drinking-water supplier may value a smaller nitrate load. Feed deliveries show the first saving. Estimating the second takes a comparison with the field’s previous management, nitrate concentration and the volume of water leaving the field. A receipt for seed documents planting. It cannot tell the utility how many pounds reached its intake.
Test the answer on your own acres
Across these studies, regenerative practices pay most reliably where they remove a cost or put a second product on the acre, and the first years carry most of the risk. Whether that holds on a particular farm depends on the passes you can drop, the job you have for a cover and the cash you can carry until the soil and the rotation pay back. Four articles follow those decisions on working farms: no-till, cover crops, manure and grazing a crop field.
Newer parts of the series price the same question on rented ground, in a longer rotation, in a drought year, on ranch pasture and for one more point of organic matter.
The most useful first step is one field with two budgets, year one and year three, built from your own custom rates or machine costs, a delivered seed quote and a yield line that includes a loss. If you then harvest adjacent strips and keep the dates and passes for each, the third season will show which line moved and whether the change pays on your ground.
Where transition funding can start
The Environmental Quality Incentives Program (EQIP) can help carry the cost of an approved change in management. Farms ready to build on existing conservation can ask about the five-year Conservation Stewardship Program (CSP). In eligible sourcing areas, the Soil and Water Outcomes Fund offers a different route for farmers adding practices that deliver water-quality or climate outcomes. Ask which acres qualify and who retains each claim before combining agreements.
The Funding Finder lists options by practice and state. In My Farm, you can save one for the field you have in mind.
What would it take to pay the farm for stewardship?
A seed bill has a date, a price and someone who owes it. Cleaner water downstream rarely comes back to the grower in such a recognizable form. A farm can provide both forage and cleaner water from the same acre, yet only the forage may pay for next year’s seed. That gap matters most when a practice is worth keeping and the farm can barely afford to keep it.
We’re building TerraValue to help establish a market for the wider benefits of stewardship, including clean water, soil kept in place, wildlife habitat, resilience and carbon. Here at Soil Health Exchange we examine the economics. FieldLog gives growers a place to record the work, its cost and what they observe. Our goal with TerraValue is to follow a change from that field record to an outcome someone values, agree how to monitor it, and work out what a payment would leave the farmer after those costs. Growers choose what they share. The market is still being developed.
What result from a farm would change a decision you make, and what evidence would you accept? Share an example with the TerraValue team.
Discussion
No comments yet. Be the first to share your thoughts!